| Business / Demographics |
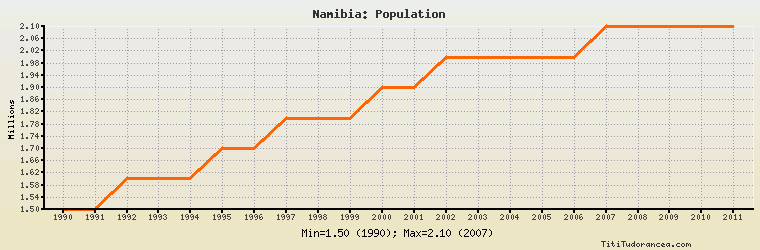
Namibia: Population
Millions
| Year | Namibia | Change, percent | Namibia, percent of Africa | Namibia, percent of World |
| 1980 | N/A | N/A | N/A | N/A |
| 1981 | N/A | N/A | N/A | N/A |
| 1982 | N/A | N/A | N/A | N/A |
| 1983 | N/A | N/A | N/A | N/A |
| 1984 | N/A | N/A | N/A | N/A |
| 1985 | N/A | N/A | N/A | N/A |
| 1986 | N/A | N/A | N/A | N/A |
| 1987 | N/A | N/A | N/A | N/A |
| 1988 | N/A | N/A | N/A | N/A |
| 1989 | N/A | N/A | N/A | N/A |
| 1990 | 1.500 | N/A | 0.239% | 0.028% |
| 1991 | 1.500 | 0.000% | 0.233% | 0.028% |
| 1992 | 1.600 | 6.667% | 0.242% | 0.029% |
| 1993 | 1.600 | 0.000% | 0.237% | 0.029% |
| 1994 | 1.600 | 0.000% | 0.230% | 0.028% |
| 1995 | 1.700 | 6.250% | 0.238% | 0.030% |
| 1996 | 1.700 | 0.000% | 0.232% | 0.029% |
| 1997 | 1.800 | 5.882% | 0.241% | 0.031% |
| 1998 | 1.800 | 0.000% | 0.235% | 0.030% |
| 1999 | 1.800 | 0.000% | 0.229% | 0.030% |
| 2000 | 1.900 | 5.556% | 0.236% | 0.031% |
| 2001 | 1.900 | 0.000% | 0.231% | 0.031% |
| 2002 | 2.000 | 5.263% | 0.237% | 0.032% |
| 2003 | 2.000 | 0.000% | 0.231% | 0.032% |
| 2004 | 2.000 | 0.000% | 0.225% | 0.031% |
| 2005 | 2.000 | 0.000% | 0.220% | 0.031% |
| 2006 | 2.000 | 0.000% | 0.214% | 0.031% |
| 2007 | 2.100 | 5.000% | 0.220% | 0.032% |
| 2008 | 2.100 | 0.000% | 0.215% | 0.031% |
| 2009 | 2.100 | 0.000% | 0.210% | 0.031% |
| 2010 | 2.100 | 0.000% | 0.205% | 0.031% |
| 2011 | 2.100 | 0.000% | 0.199% | 0.030% |
Historical Energy Data about Namibia
Total Consumption of Petroleum Products
Oil and Petroleum Products, Net Exports/Imports (-)
Dry Natural Gas, Net Exports/Imports (-)
Proved Reserves of Natural Gas
Total Coal Consumption
Coal, Net Exports/Imports (-)
Total Electricity Net Generation
Total Electricity Net Consumption
Total Electricity Exports
Total Electricity Imports
Electricity, Net Exports/Imports (-)
Total Conventional Thermal Electricity Net Generation
Hydroelectricity Net Generation
Total Primary Energy Production
Total Primary Energy Consumption
Total Carbon Dioxide Emissions from the Consumption of Energy
Population