| Business / Energy Data |
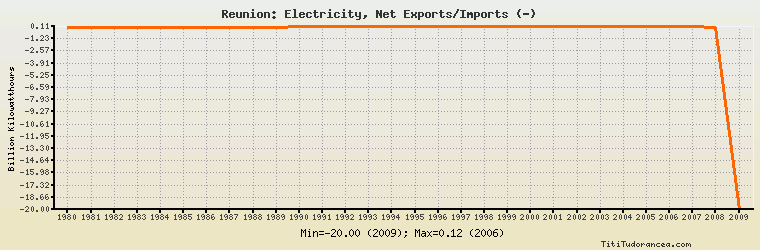
Reunion: Electricity, Net Exports/Imports (-)
Billion Kilowatthours
| Year | Reunion | Change, percent | Reunion, percent of Africa | Reunion, percent of World |
| 1980 | 0.024 | N/A | - | N/A |
| 1981 | 0.027 | 12.500% | - | N/A |
| 1982 | 0.030 | 11.111% | -333.333% | N/A |
| 1983 | 0.034 | 13.333% | -12.230% | N/A |
| 1984 | 0.036 | 5.882% | -70.588% | N/A |
| 1985 | 0.039 | 8.333% | - | N/A |
| 1986 | 0.042 | 7.692% | -36.522% | N/A |
| 1987 | 0.047 | 11.905% | -23.500% | N/A |
| 1988 | 0.052 | 10.638% | -19.403% | N/A |
| 1989 | 0.055 | 5.769% | -56.122% | N/A |
| 1990 | 0.062 | 12.727% | -12.705% | N/A |
| 1991 | 0.067 | 8.065% | -28.632% | N/A |
| 1992 | 0.073 | 8.955% | 49.324% | N/A |
| 1993 | 0.074 | 1.370% | -145.098% | N/A |
| 1994 | 0.075 | 1.351% | -59.524% | N/A |
| 1995 | 0.081 | 8.000% | 17.802% | N/A |
| 1996 | 0.085 | 4.938% | 4.794% | N/A |
| 1997 | 0.099 | 16.471% | 6.278% | N/A |
| 1998 | 0.105 | 6.061% | -2.978% | N/A |
| 1999 | 0.105 | 0.000% | -4.261% | N/A |
| 2000 | 0.106 | 0.952% | -2.821% | N/A |
| 2001 | 0.106 | 0.000% | -3.852% | N/A |
| 2002 | 0.108 | 1.887% | -5.947% | N/A |
| 2003 | 0.108 | 0.000% | -3.446% | N/A |
| 2004 | 0.111 | 2.778% | -6.764% | N/A |
| 2005 | 0.113 | 1.802% | -5.108% | N/A |
| 2006 | 0.115 | 1.770% | -2.830% | N/A |
| 2007 | 0.115 | 0.000% | -2.510% | N/A |
| 2008 | 0.000 | -100.000% | 0.00% | N/A |
| 2009 | -20.000 | 0.000% | 464.037% | N/A |
Historical Energy Data about Reunion
Total Consumption of Petroleum Products
Oil and Petroleum Products, Net Exports/Imports (-)
Dry Natural Gas, Net Exports/Imports (-)
Coal, Net Exports/Imports (-)
Total Electricity Net Generation
Total Electricity Net Consumption
Electricity, Net Exports/Imports (-)
Total Conventional Thermal Electricity Net Generation
Hydroelectricity Net Generation
Total Primary Energy Production
Total Primary Energy Consumption
Total Carbon Dioxide Emissions from the Consumption of Energy