| Business / Energy Data |
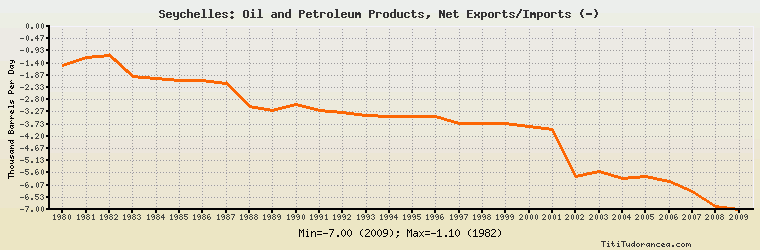
Seychelles: Oil and Petroleum Products, Net Exports/Imports (-)
Thousand Barrels Per Day
| Year | Seychelles | Change, percent | Seychelles, percent of Africa | Seychelles, percent of World |
| 1980 | -1.500 | N/A | -0.032% | N/A |
| 1981 | -1.200 | -20.000% | -0.036% | N/A |
| 1982 | -1.100 | -8.333% | -0.034% | N/A |
| 1983 | -1.900 | 72.727% | -0.059% | N/A |
| 1984 | -2.000 | 5.263% | -0.056% | N/A |
| 1985 | -2.073 | 3.650% | -0.055% | N/A |
| 1986 | -2.051 | -1.061% | -0.055% | N/A |
| 1987 | -2.183 | 6.436% | -0.060% | N/A |
| 1988 | -3.053 | 39.853% | -0.078% | N/A |
| 1989 | -3.232 | 5.863% | -0.076% | N/A |
| 1990 | -2.969 | -8.137% | -0.064% | N/A |
| 1991 | -3.195 | 7.612% | -0.066% | N/A |
| 1992 | -3.297 | 3.192% | -0.067% | N/A |
| 1993 | -3.389 | 2.790% | -0.070% | N/A |
| 1994 | -3.430 | 1.210% | -0.071% | N/A |
| 1995 | -3.453 | 0.671% | -0.068% | N/A |
| 1996 | -3.444 | -0.261% | -0.066% | N/A |
| 1997 | -3.701 | 7.462% | -0.068% | N/A |
| 1998 | -3.701 | 0.000% | -0.069% | N/A |
| 1999 | -3.701 | 0.000% | -0.070% | N/A |
| 2000 | -3.837 | 3.675% | -0.071% | N/A |
| 2001 | -3.952 | 2.997% | -0.073% | N/A |
| 2002 | -5.725 | 44.863% | -0.105% | N/A |
| 2003 | -5.543 | -3.179% | -0.095% | N/A |
| 2004 | -5.800 | 4.636% | -0.090% | N/A |
| 2005 | -5.719 | -1.397% | -0.080% | N/A |
| 2006 | -5.917 | 3.462% | -0.082% | N/A |
| 2007 | -6.299 | 6.456% | -0.085% | N/A |
| 2008 | -6.900 | 9.541% | -0.093% | N/A |
| 2009 | -7.000 | 1.449% | -0.099% | N/A |
Historical Energy Data about Seychelles
Total Consumption of Petroleum Products
Oil and Petroleum Products, Net Exports/Imports (-)
Dry Natural Gas, Net Exports/Imports (-)
Coal, Net Exports/Imports (-)
Total Electricity Net Generation
Total Electricity Net Consumption
Electricity, Net Exports/Imports (-)
Total Conventional Thermal Electricity Net Generation
Total Primary Energy Consumption
Total Carbon Dioxide Emissions from the Consumption of Energy
Population