| Business / Energy Data |
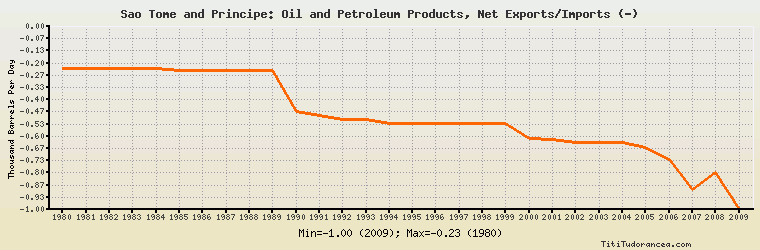
Sao Tome and Principe: Oil and Petroleum Products, Net Exports/Imports (-)
Thousand Barrels Per Day
| Year | Sao Tome and Principe | Change, percent | Sao Tome and Principe, percent of Africa | Sao Tome and Principe, percent of World |
| 1980 | -0.230 | N/A | -0.005% | N/A |
| 1981 | -0.230 | 0.000% | -0.007% | N/A |
| 1982 | -0.230 | 0.000% | -0.007% | N/A |
| 1983 | -0.230 | 0.000% | -0.007% | N/A |
| 1984 | -0.230 | 0.000% | -0.006% | N/A |
| 1985 | -0.240 | 4.348% | -0.006% | N/A |
| 1986 | -0.240 | 0.000% | -0.006% | N/A |
| 1987 | -0.240 | 0.000% | -0.007% | N/A |
| 1988 | -0.240 | 0.000% | -0.006% | N/A |
| 1989 | -0.240 | 0.000% | -0.006% | N/A |
| 1990 | -0.465 | 93.750% | -0.010% | N/A |
| 1991 | -0.489 | 5.161% | -0.010% | N/A |
| 1992 | -0.508 | 3.885% | -0.010% | N/A |
| 1993 | -0.510 | 0.394% | -0.010% | N/A |
| 1994 | -0.530 | 3.922% | -0.011% | N/A |
| 1995 | -0.530 | 0.000% | -0.010% | N/A |
| 1996 | -0.529 | -0.189% | -0.010% | N/A |
| 1997 | -0.530 | 0.189% | -0.010% | N/A |
| 1998 | -0.530 | 0.000% | -0.010% | N/A |
| 1999 | -0.530 | 0.000% | -0.010% | N/A |
| 2000 | -0.614 | 15.849% | -0.011% | N/A |
| 2001 | -0.616 | 0.326% | -0.011% | N/A |
| 2002 | -0.636 | 3.247% | -0.012% | N/A |
| 2003 | -0.636 | 0.000% | -0.011% | N/A |
| 2004 | -0.634 | -0.314% | -0.010% | N/A |
| 2005 | -0.660 | 4.101% | -0.009% | N/A |
| 2006 | -0.726 | 10.000% | -0.010% | N/A |
| 2007 | -0.889 | 22.452% | -0.012% | N/A |
| 2008 | -0.800 | -10.011% | -0.011% | N/A |
| 2009 | -1.000 | 25.000% | -0.014% | N/A |
Historical Energy Data about Sao Tome and Principe
Total Consumption of Petroleum Products
Oil and Petroleum Products, Net Exports/Imports (-)
Dry Natural Gas, Net Exports/Imports (-)
Coal, Net Exports/Imports (-)
Total Electricity Net Generation
Total Electricity Net Consumption
Electricity, Net Exports/Imports (-)
Total Conventional Thermal Electricity Net Generation
Hydroelectricity Net Generation
Total Primary Energy Consumption
Total Carbon Dioxide Emissions from the Consumption of Energy
Population