| Business / Energy Data |
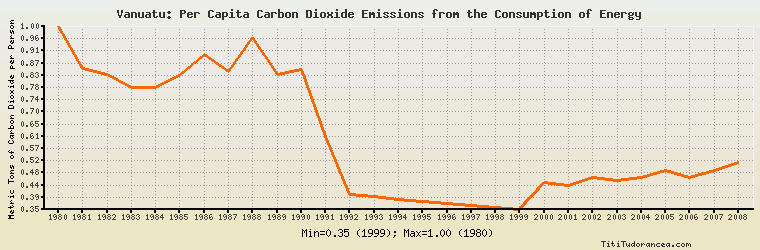
Vanuatu: Per Capita Carbon Dioxide Emissions from the Consumption of Energy
Metric Tons of Carbon Dioxide per Person
| Year | Vanuatu | Change, percent | Vanuatu, percent of Asia & Oceania | Vanuatu, percent of World |
| 1980 | 0.999 | N/A | N/A | 24.055% |
| 1981 | 0.850 | -14.915% | N/A | 21.076% |
| 1982 | 0.829 | -2.471% | N/A | 21.046% |
| 1983 | 0.781 | -5.790% | N/A | 20.031% |
| 1984 | 0.784 | 0.384% | N/A | 19.507% |
| 1985 | 0.825 | 5.230% | N/A | 20.411% |
| 1986 | 0.900 | 9.091% | N/A | 22.146% |
| 1987 | 0.838 | -6.889% | N/A | 20.449% |
| 1988 | 0.960 | 14.558% | N/A | 23.066% |
| 1989 | 0.827 | -13.854% | N/A | 19.923% |
| 1990 | 0.848 | 2.539% | N/A | 20.663% |
| 1991 | 0.610 | -28.066% | N/A | 15.174% |
| 1992 | 0.404 | -33.770% | N/A | 10.251% |
| 1993 | 0.394 | -2.475% | N/A | 10.036% |
| 1994 | 0.386 | -2.030% | N/A | 9.905% |
| 1995 | 0.378 | -2.073% | N/A | 9.685% |
| 1996 | 0.370 | -2.116% | N/A | 9.400% |
| 1997 | 0.363 | -1.892% | N/A | 9.181% |
| 1998 | 0.356 | -1.928% | N/A | 9.149% |
| 1999 | 0.349 | -1.966% | N/A | 8.965% |
| 2000 | 0.444 | 27.221% | N/A | 11.315% |
| 2001 | 0.436 | -1.802% | N/A | 11.177% |
| 2002 | 0.461 | 5.734% | N/A | 11.615% |
| 2003 | 0.453 | -1.735% | N/A | 11.009% |
| 2004 | 0.463 | 2.208% | N/A | 10.705% |
| 2005 | 0.486 | 4.968% | N/A | 11.030% |
| 2006 | 0.463 | -4.733% | N/A | 10.423% |
| 2007 | 0.489 | 5.616% | N/A | 10.826% |
| 2008 | 0.516 | 5.521% | N/A | 11.366% |
| 2009 | N/A | N/A | N/A | N/A |
| 2010 | N/A | N/A | N/A | N/A |
Historical Energy Data about Vanuatu
Total Consumption of Petroleum Products
Oil and Petroleum Products, Net Exports/Imports (-)
Dry Natural Gas, Net Exports/Imports (-)
Coal, Net Exports/Imports (-)
Total Electricity Net Generation
Total Electricity Net Consumption
Electricity, Net Exports/Imports (-)
Total Conventional Thermal Electricity Net Generation
Total Primary Energy Consumption
Total Carbon Dioxide Emissions from the Consumption of Energy
Population