| Business / Energy Data |
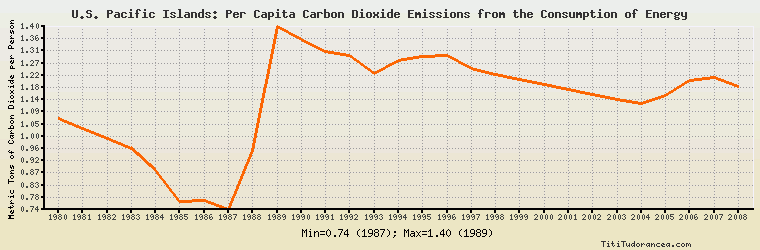
U.S. Pacific Islands: Per Capita Carbon Dioxide Emissions from the Consumption of Energy
Metric Tons of Carbon Dioxide per Person
| Year | U.S. Pacific Islands | Change, percent | U.S. Pacific Islands, percent of Asia & Oceania | U.S. Pacific Islands, percent of World |
| 1980 | 1.068 | N/A | N/A | 25.716% |
| 1981 | 1.030 | -3.558% | N/A | 25.539% |
| 1982 | 0.995 | -3.398% | N/A | 25.260% |
| 1983 | 0.961 | -3.417% | N/A | 24.647% |
| 1984 | 0.879 | -8.533% | N/A | 21.871% |
| 1985 | 0.767 | -12.742% | N/A | 18.976% |
| 1986 | 0.773 | 0.782% | N/A | 19.021% |
| 1987 | 0.739 | -4.398% | N/A | 18.033% |
| 1988 | 0.953 | 28.958% | N/A | 22.898% |
| 1989 | 1.400 | 46.905% | N/A | 33.727% |
| 1990 | 1.353 | -3.357% | N/A | 32.968% |
| 1991 | 1.310 | -3.178% | N/A | 32.587% |
| 1992 | 1.297 | -0.992% | N/A | 32.910% |
| 1993 | 1.232 | -5.012% | N/A | 31.381% |
| 1994 | 1.278 | 3.734% | N/A | 32.794% |
| 1995 | 1.292 | 1.095% | N/A | 33.103% |
| 1996 | 1.296 | 0.310% | N/A | 32.927% |
| 1997 | 1.250 | -3.549% | N/A | 31.614% |
| 1998 | 1.226 | -1.920% | N/A | 31.509% |
| 1999 | 1.207 | -1.550% | N/A | 31.004% |
| 2000 | 1.189 | -1.491% | N/A | 30.301% |
| 2001 | 1.172 | -1.430% | N/A | 30.044% |
| 2002 | 1.155 | -1.451% | N/A | 29.101% |
| 2003 | 1.138 | -1.472% | N/A | 27.655% |
| 2004 | 1.122 | -1.406% | N/A | 25.942% |
| 2005 | 1.151 | 2.585% | N/A | 26.123% |
| 2006 | 1.205 | 4.692% | N/A | 27.127% |
| 2007 | 1.214 | 0.747% | N/A | 26.876% |
| 2008 | 1.183 | -2.554% | N/A | 26.057% |
| 2009 | N/A | N/A | N/A | N/A |
| 2010 | N/A | N/A | N/A | N/A |
Historical Energy Data about U.S. Pacific Islands
Total Consumption of Petroleum Products
Oil and Petroleum Products, Net Exports/Imports (-)
Dry Natural Gas, Net Exports/Imports (-)
Coal, Net Exports/Imports (-)
Total Electricity Net Generation
Total Electricity Net Consumption
Electricity, Net Exports/Imports (-)
Total Conventional Thermal Electricity Net Generation
Hydroelectricity Net Generation
Total Primary Energy Consumption
Total Carbon Dioxide Emissions from the Consumption of Energy
Population