| Business / Energy Data |
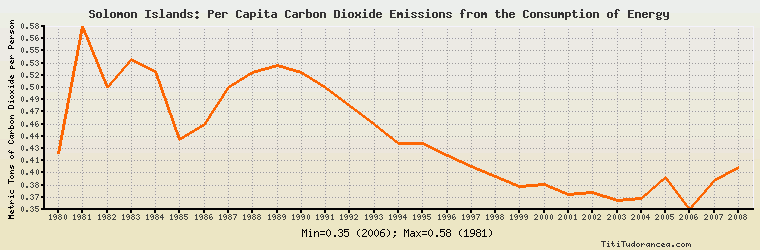
Solomon Islands: Per Capita Carbon Dioxide Emissions from the Consumption of Energy
Metric Tons of Carbon Dioxide per Person
| Year | Solomon Islands | Change, percent | Solomon Islands, percent of Asia & Oceania | Solomon Islands, percent of World |
| 1980 | 0.420 | N/A | N/A | 10.113% |
| 1981 | 0.577 | 37.381% | N/A | 14.307% |
| 1982 | 0.502 | -12.998% | N/A | 12.744% |
| 1983 | 0.536 | 6.773% | N/A | 13.747% |
| 1984 | 0.522 | -2.612% | N/A | 12.988% |
| 1985 | 0.437 | -16.284% | N/A | 10.811% |
| 1986 | 0.456 | 4.348% | N/A | 11.220% |
| 1987 | 0.502 | 10.088% | N/A | 12.250% |
| 1988 | 0.520 | 3.586% | N/A | 12.494% |
| 1989 | 0.529 | 1.731% | N/A | 12.744% |
| 1990 | 0.520 | -1.701% | N/A | 12.671% |
| 1991 | 0.502 | -3.462% | N/A | 12.488% |
| 1992 | 0.480 | -4.382% | N/A | 12.180% |
| 1993 | 0.456 | -5.000% | N/A | 11.615% |
| 1994 | 0.432 | -5.263% | N/A | 11.085% |
| 1995 | 0.432 | 0.000% | N/A | 11.068% |
| 1996 | 0.418 | -3.241% | N/A | 10.620% |
| 1997 | 0.404 | -3.349% | N/A | 10.218% |
| 1998 | 0.392 | -2.970% | N/A | 10.075% |
| 1999 | 0.379 | -3.316% | N/A | 9.735% |
| 2000 | 0.382 | 0.792% | N/A | 9.735% |
| 2001 | 0.370 | -3.141% | N/A | 9.485% |
| 2002 | 0.372 | 0.541% | N/A | 9.373% |
| 2003 | 0.362 | -2.688% | N/A | 8.797% |
| 2004 | 0.364 | 0.552% | N/A | 8.416% |
| 2005 | 0.390 | 7.143% | N/A | 8.852% |
| 2006 | 0.351 | -10.000% | N/A | 7.902% |
| 2007 | 0.387 | 10.256% | N/A | 8.568% |
| 2008 | 0.403 | 4.134% | N/A | 8.877% |
| 2009 | N/A | N/A | N/A | N/A |
| 2010 | N/A | N/A | N/A | N/A |
Historical Energy Data about Solomon Islands
Total Consumption of Petroleum Products
Oil and Petroleum Products, Net Exports/Imports (-)
Dry Natural Gas, Net Exports/Imports (-)
Coal, Net Exports/Imports (-)
Total Electricity Net Generation
Total Electricity Net Consumption
Electricity, Net Exports/Imports (-)
Total Conventional Thermal Electricity Net Generation
Total Primary Energy Consumption
Total Carbon Dioxide Emissions from the Consumption of Energy
Population