| Business / Energy Data |
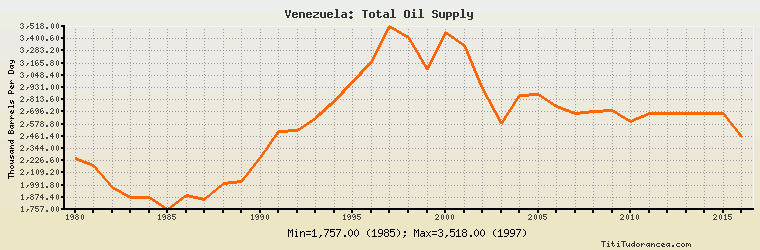
Venezuela: Total Oil Supply
Thousand Barrels Per Day
| Year | Venezuela | Change, percent | Venezuela, percent of Central & South America | Venezuela, percent of World |
| 1980 | 2,246.000 | N/A | 58.353% | 3.510% |
| 1981 | 2,177.000 | -3.072% | 56.414% | 3.592% |
| 1982 | 1,973.000 | -9.371% | 53.600% | 3.396% |
| 1983 | 1,874.000 | -5.018% | 50.979% | 3.235% |
| 1984 | 1,872.000 | -0.107% | 48.163% | 3.143% |
| 1985 | 1,757.000 | -6.143% | 44.865% | 2.970% |
| 1986 | 1,890.000 | 7.570% | 45.663% | 3.071% |
| 1987 | 1,857.000 | -1.746% | 45.584% | 2.990% |
| 1988 | 2,008.000 | 8.131% | 46.516% | 3.118% |
| 1989 | 2,025.000 | 0.847% | 46.348% | 3.090% |
| 1990 | 2,262.000 | 11.704% | 48.103% | 3.405% |
| 1991 | 2,510.000 | 10.964% | 50.669% | 3.784% |
| 1992 | 2,520.000 | 0.398% | 49.938% | 3.786% |
| 1993 | 2,634.000 | 4.524% | 49.744% | 3.925% |
| 1994 | 2,796.000 | 6.150% | 49.301% | 4.074% |
| 1995 | 2,982.000 | 6.652% | 48.725% | 4.241% |
| 1996 | 3,175.000 | 6.472% | 48.642% | 4.410% |
| 1997 | 3,518.000 | 10.803% | 50.102% | 4.740% |
| 1998 | 3,409.000 | -3.098% | 47.894% | 4.504% |
| 1999 | 3,109.000 | -8.800% | 44.387% | 4.154% |
| 2000 | 3,460.759 | 11.314% | 47.323% | 4.452% |
| 2001 | 3,333.988 | -3.663% | 46.191% | 4.292% |
| 2002 | 2,924.204 | -12.291% | 42.206% | 3.793% |
| 2003 | 2,581.429 | -11.722% | 38.618% | 3.242% |
| 2004 | 2,855.168 | 10.604% | 40.638% | 3.421% |
| 2005 | 2,866.931 | 0.412% | 39.584% | 3.368% |
| 2006 | 2,746.534 | -4.200% | 37.646% | 3.224% |
| 2007 | 2,681.992 | -2.350% | 36.888% | 3.146% |
| 2008 | 2,701.680 | 0.734% | 35.972% | 3.118% |
| 2009 | 2,710.293 | 0.319% | 35.078% | 3.157% |
| 2010 | 2,599.489 | -4.088% | 33.068% | 2.946% |
| 2011 | 2,684.373 | 3.265% | 33.382% | 3.023% |
| 2012 | 2,684.550 | 0.007% | 33.592% | 2.957% |
| 2013 | 2,684.550 | 0.000% | 33.115% | 2.941% |
| 2014 | 2,684.550 | 0.000% | 31.985% | 2.861% |
| 2015 | 2,684.550 | 0.000% | 31.283% | 2.773% |
| 2016 | 2,461.517 | -8.308% | 29.757% | 2.533% |
Historical Energy Data about Venezuela
Total Oil Supply
Total Consumption of Petroleum Products
Oil and Petroleum Products, Net Exports/Imports (-)
Production of Crude Oil including Lease Condensate
Crude Oil Proved Reserves
Dry Natural Gas Production
Dry Natural Gas Consumption
Dry Natural Gas, Net Exports/Imports (-)
Proved Reserves of Natural Gas
Total Primary Coal Production
Total Coal Consumption
Coal, Net Exports/Imports (-)
Total Recoverable Coal
Total Electricity Net Generation
Total Electricity Net Consumption
Total Electricity Exports
Total Electricity Imports
Electricity, Net Exports/Imports (-)
Total Conventional Thermal Electricity Net Generation
Hydroelectricity Net Generation
Total Primary Energy Production
Total Primary Energy Consumption
Total Carbon Dioxide Emissions from the Consumption of Energy
Population