| Business / Energy Data |
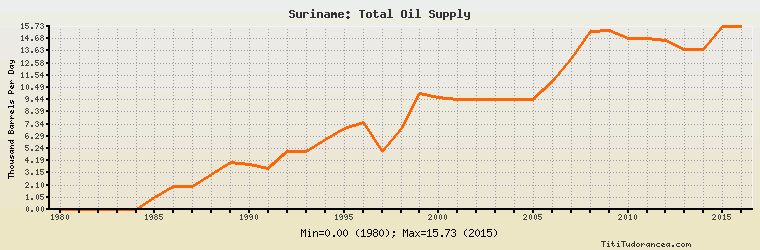
Suriname: Total Oil Supply
Thousand Barrels Per Day
| Year | Suriname | Change, percent | Suriname, percent of Central & South America | Suriname, percent of World |
| 1980 | 0.000 | N/A | 0.00% | 0.00% |
| 1981 | 0.000 | 0.000% | 0.00% | 0.00% |
| 1982 | 0.000 | 0.000% | 0.00% | 0.00% |
| 1983 | 0.000 | 0.000% | 0.00% | 0.00% |
| 1984 | 0.000 | 0.000% | 0.00% | 0.00% |
| 1985 | 1.000 | 0.000% | 0.026% | 0.002% |
| 1986 | 2.000 | 100.000% | 0.048% | 0.003% |
| 1987 | 2.000 | 0.000% | 0.049% | 0.003% |
| 1988 | 3.000 | 50.000% | 0.069% | 0.005% |
| 1989 | 4.000 | 33.333% | 0.092% | 0.006% |
| 1990 | 3.900 | -2.500% | 0.083% | 0.006% |
| 1991 | 3.500 | -10.256% | 0.071% | 0.005% |
| 1992 | 5.000 | 42.857% | 0.099% | 0.008% |
| 1993 | 5.000 | 0.000% | 0.094% | 0.007% |
| 1994 | 6.000 | 20.000% | 0.106% | 0.009% |
| 1995 | 7.000 | 16.667% | 0.114% | 0.010% |
| 1996 | 7.500 | 7.143% | 0.115% | 0.010% |
| 1997 | 5.000 | -33.333% | 0.071% | 0.007% |
| 1998 | 7.000 | 40.000% | 0.098% | 0.009% |
| 1999 | 10.000 | 42.857% | 0.143% | 0.013% |
| 2000 | 9.585 | -4.150% | 0.131% | 0.012% |
| 2001 | 9.496 | -0.929% | 0.132% | 0.012% |
| 2002 | 9.496 | 0.000% | 0.137% | 0.012% |
| 2003 | 9.462 | -0.358% | 0.142% | 0.012% |
| 2004 | 9.461 | -0.011% | 0.135% | 0.011% |
| 2005 | 9.439 | -0.233% | 0.130% | 0.011% |
| 2006 | 11.018 | 16.728% | 0.151% | 0.013% |
| 2007 | 12.960 | 17.626% | 0.178% | 0.015% |
| 2008 | 15.267 | 17.801% | 0.203% | 0.018% |
| 2009 | 15.419 | 0.996% | 0.200% | 0.018% |
| 2010 | 14.731 | -4.462% | 0.187% | 0.017% |
| 2011 | 14.731 | 0.000% | 0.183% | 0.017% |
| 2012 | 14.564 | -1.134% | 0.182% | 0.016% |
| 2013 | 13.731 | -5.720% | 0.169% | 0.015% |
| 2014 | 13.731 | 0.000% | 0.164% | 0.015% |
| 2015 | 15.731 | 14.566% | 0.183% | 0.016% |
| 2016 | 15.731 | 0.000% | 0.190% | 0.016% |
Historical Energy Data about Suriname
Total Oil Supply
Total Consumption of Petroleum Products
Oil and Petroleum Products, Net Exports/Imports (-)
Production of Crude Oil including Lease Condensate
Crude Oil Proved Reserves
Dry Natural Gas, Net Exports/Imports (-)
Total Coal Consumption
Coal, Net Exports/Imports (-)
Total Electricity Net Generation
Total Electricity Net Consumption
Electricity, Net Exports/Imports (-)
Total Conventional Thermal Electricity Net Generation
Hydroelectricity Net Generation
Total Primary Energy Production
Total Primary Energy Consumption
Total Carbon Dioxide Emissions from the Consumption of Energy
Population