| Business / Energy Data |
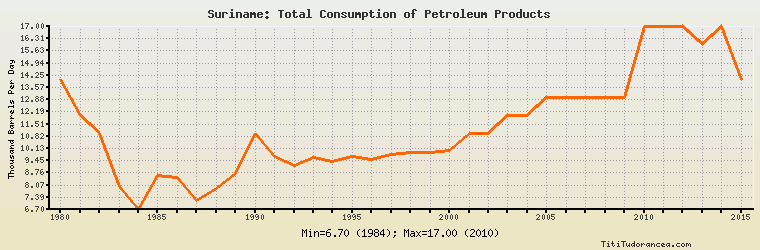
Suriname: Total Consumption of Petroleum Products
Thousand Barrels Per Day
| Year | Suriname | Change, percent | Suriname, percent of Central & South America | Suriname, percent of World |
| 1980 | 14.000 | N/A | 0.425% | 0.022% |
| 1981 | 12.000 | -14.286% | 0.337% | 0.020% |
| 1982 | 11.000 | -8.333% | 0.322% | 0.018% |
| 1983 | 8.000 | -27.273% | 0.247% | 0.014% |
| 1984 | 6.700 | -16.250% | 0.205% | 0.011% |
| 1985 | 8.600 | 28.358% | 0.266% | 0.014% |
| 1986 | 8.500 | -1.163% | 0.246% | 0.014% |
| 1987 | 7.200 | -15.294% | 0.202% | 0.011% |
| 1988 | 7.900 | 9.722% | 0.219% | 0.012% |
| 1989 | 8.700 | 10.127% | 0.240% | 0.013% |
| 1990 | 11.000 | 26.437% | 0.292% | 0.017% |
| 1991 | 9.700 | -11.818% | 0.253% | 0.014% |
| 1992 | 9.200 | -5.155% | 0.233% | 0.014% |
| 1993 | 9.600 | 4.348% | 0.235% | 0.014% |
| 1994 | 9.400 | -2.083% | 0.220% | 0.014% |
| 1995 | 9.700 | 3.191% | 0.217% | 0.014% |
| 1996 | 9.500 | -2.062% | 0.203% | 0.013% |
| 1997 | 9.800 | 3.158% | 0.200% | 0.013% |
| 1998 | 9.900 | 1.020% | 0.196% | 0.013% |
| 1999 | 9.900 | 0.000% | 0.190% | 0.013% |
| 2000 | 10.000 | 1.010% | 0.189% | 0.013% |
| 2001 | 11.000 | 10.000% | 0.207% | 0.014% |
| 2002 | 11.000 | 0.000% | 0.211% | 0.014% |
| 2003 | 12.000 | 9.091% | 0.231% | 0.015% |
| 2004 | 12.000 | 0.000% | 0.221% | 0.014% |
| 2005 | 13.000 | 8.333% | 0.232% | 0.015% |
| 2006 | 13.000 | 0.000% | 0.224% | 0.015% |
| 2007 | 13.000 | 0.000% | 0.219% | 0.015% |
| 2008 | 13.000 | 0.000% | 0.222% | 0.015% |
| 2009 | 13.000 | 0.000% | 0.210% | 0.015% |
| 2010 | 17.000 | 30.769% | 0.257% | 0.019% |
| 2011 | 17.000 | 0.000% | 0.252% | 0.019% |
| 2012 | 17.000 | 0.000% | 0.241% | 0.019% |
| 2013 | 16.000 | -5.882% | 0.225% | 0.017% |
| 2014 | 17.000 | 6.250% | 0.234% | 0.018% |
| 2015 | 14.000 | -17.647% | 0.194% | 0.015% |
Historical Energy Data about Suriname
Total Oil Supply
Total Consumption of Petroleum Products
Oil and Petroleum Products, Net Exports/Imports (-)
Production of Crude Oil including Lease Condensate
Crude Oil Proved Reserves
Dry Natural Gas, Net Exports/Imports (-)
Total Coal Consumption
Coal, Net Exports/Imports (-)
Total Electricity Net Generation
Total Electricity Net Consumption
Electricity, Net Exports/Imports (-)
Total Conventional Thermal Electricity Net Generation
Hydroelectricity Net Generation
Total Primary Energy Production
Total Primary Energy Consumption
Total Carbon Dioxide Emissions from the Consumption of Energy
Population