| Business / Energy Data |
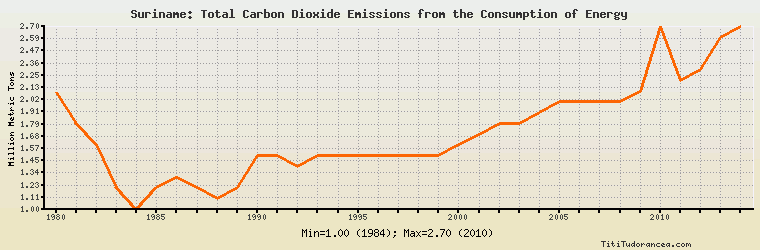
Suriname: Total Carbon Dioxide Emissions from the Consumption of Energy
Million Metric Tons
| Year | Suriname | Change, percent | Suriname, percent of Central & South America | Suriname, percent of World |
| 1980 | 2.089 | N/A | 0.335% | 0.011% |
| 1981 | 1.800 | -13.834% | 0.292% | 0.010% |
| 1982 | 1.600 | -11.111% | 0.261% | 0.009% |
| 1983 | 1.200 | -25.000% | 0.203% | 0.007% |
| 1984 | 1.000 | -16.667% | 0.162% | 0.005% |
| 1985 | 1.200 | 20.000% | 0.194% | 0.006% |
| 1986 | 1.300 | 8.333% | 0.194% | 0.007% |
| 1987 | 1.200 | -7.692% | 0.175% | 0.006% |
| 1988 | 1.100 | -8.333% | 0.159% | 0.005% |
| 1989 | 1.200 | 9.091% | 0.169% | 0.006% |
| 1990 | 1.500 | 25.000% | 0.208% | 0.007% |
| 1991 | 1.500 | 0.000% | 0.204% | 0.007% |
| 1992 | 1.400 | -6.667% | 0.189% | 0.007% |
| 1993 | 1.500 | 7.143% | 0.192% | 0.007% |
| 1994 | 1.500 | 0.000% | 0.185% | 0.007% |
| 1995 | 1.500 | 0.000% | 0.175% | 0.007% |
| 1996 | 1.500 | 0.000% | 0.167% | 0.007% |
| 1997 | 1.500 | 0.000% | 0.159% | 0.007% |
| 1998 | 1.500 | 0.000% | 0.156% | 0.007% |
| 1999 | 1.500 | 0.000% | 0.154% | 0.007% |
| 2000 | 1.600 | 6.667% | 0.161% | 0.007% |
| 2001 | 1.700 | 6.250% | 0.168% | 0.007% |
| 2002 | 1.800 | 5.882% | 0.179% | 0.007% |
| 2003 | 1.800 | 0.000% | 0.177% | 0.007% |
| 2004 | 1.900 | 5.556% | 0.180% | 0.007% |
| 2005 | 2.000 | 5.263% | 0.182% | 0.007% |
| 2006 | 2.000 | 0.000% | 0.175% | 0.007% |
| 2007 | 2.000 | 0.000% | 0.172% | 0.007% |
| 2008 | 2.000 | 0.000% | 0.166% | 0.007% |
| 2009 | 2.100 | 5.000% | 0.176% | 0.007% |
| 2010 | 2.700 | 28.571% | 0.208% | 0.009% |
| 2011 | 2.200 | -18.519% | 0.165% | 0.007% |
| 2012 | 2.300 | 4.545% | 0.167% | 0.007% |
| 2013 | 2.600 | 13.043% | 0.183% | 0.008% |
| 2014 | 2.700 | 3.846% | 0.185% | 0.008% |
Historical Energy Data about Suriname
Total Oil Supply
Total Consumption of Petroleum Products
Oil and Petroleum Products, Net Exports/Imports (-)
Production of Crude Oil including Lease Condensate
Crude Oil Proved Reserves
Dry Natural Gas, Net Exports/Imports (-)
Total Coal Consumption
Coal, Net Exports/Imports (-)
Total Electricity Net Generation
Total Electricity Net Consumption
Electricity, Net Exports/Imports (-)
Total Conventional Thermal Electricity Net Generation
Hydroelectricity Net Generation
Total Primary Energy Production
Total Primary Energy Consumption
Total Carbon Dioxide Emissions from the Consumption of Energy
Population