| Business / Energy Data |
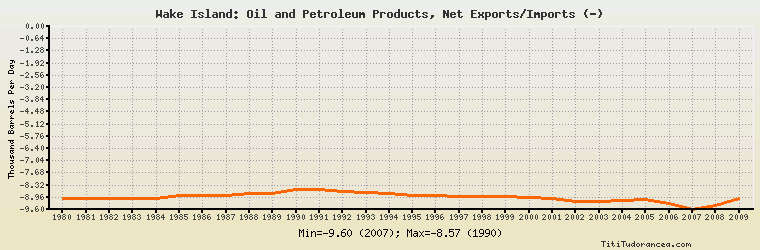
Wake Island: Oil and Petroleum Products, Net Exports/Imports (-)
Thousand Barrels Per Day
| Year | Wake Island | Change, percent | Wake Island, percent of Asia & Oceania | Wake Island, percent of World |
| 1980 | -9.000 | N/A | 0.160% | N/A |
| 1981 | -9.000 | 0.000% | 0.161% | N/A |
| 1982 | -9.000 | 0.000% | 0.164% | N/A |
| 1983 | -9.000 | 0.000% | 0.176% | N/A |
| 1984 | -9.000 | 0.000% | 0.176% | N/A |
| 1985 | -8.852 | -1.644% | 0.187% | N/A |
| 1986 | -8.855 | 0.034% | 0.180% | N/A |
| 1987 | -8.855 | 0.000% | 0.167% | N/A |
| 1988 | -8.761 | -1.062% | 0.145% | N/A |
| 1989 | -8.785 | 0.274% | 0.133% | N/A |
| 1990 | -8.567 | -2.482% | 0.121% | N/A |
| 1991 | -8.567 | 0.000% | 0.114% | N/A |
| 1992 | -8.673 | 1.237% | 0.105% | N/A |
| 1993 | -8.696 | 0.265% | 0.097% | N/A |
| 1994 | -8.756 | 0.690% | 0.089% | N/A |
| 1995 | -8.846 | 1.028% | 0.085% | N/A |
| 1996 | -8.864 | 0.203% | 0.081% | N/A |
| 1997 | -8.937 | 0.824% | 0.077% | N/A |
| 1998 | -8.937 | 0.000% | 0.080% | N/A |
| 1999 | -8.937 | 0.000% | 0.073% | N/A |
| 2000 | -8.979 | 0.470% | 0.072% | N/A |
| 2001 | -9.003 | 0.267% | 0.071% | N/A |
| 2002 | -9.157 | 1.711% | 0.069% | N/A |
| 2003 | -9.157 | 0.000% | 0.064% | N/A |
| 2004 | -9.132 | -0.273% | 0.059% | N/A |
| 2005 | -9.091 | -0.449% | 0.058% | N/A |
| 2006 | -9.300 | 2.299% | 0.057% | N/A |
| 2007 | -9.600 | 3.226% | 0.057% | N/A |
| 2008 | -9.400 | -2.083% | 0.057% | N/A |
| 2009 | -9.000 | -4.255% | 0.052% | N/A |
Historical Energy Data about Wake Island
Total Consumption of Petroleum Products
Oil and Petroleum Products, Net Exports/Imports (-)
Dry Natural Gas, Net Exports/Imports (-)
Coal, Net Exports/Imports (-)
Electricity, Net Exports/Imports (-)
Total Primary Energy Consumption
Total Carbon Dioxide Emissions from the Consumption of Energy