| Business / Energy Data |
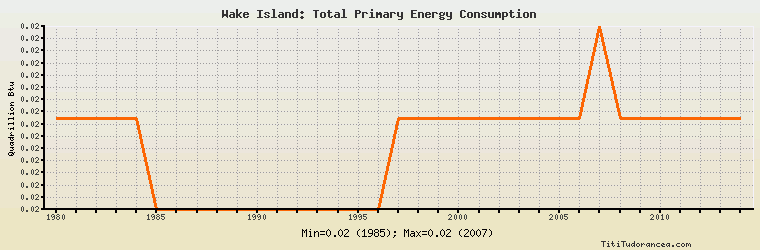
Wake Island: Total Primary Energy Consumption
Quadrillion Btu
| Year | Wake Island | Change, percent | Wake Island, percent of Asia & Oceania | Wake Island, percent of World |
| 1980 | 0.019 | N/A | 0.040% | 0.007% |
| 1981 | 0.019 | 0.000% | 0.040% | 0.007% |
| 1982 | 0.019 | 0.000% | 0.040% | 0.007% |
| 1983 | 0.019 | 0.000% | 0.038% | 0.007% |
| 1984 | 0.019 | 0.000% | 0.036% | 0.006% |
| 1985 | 0.018 | -5.263% | 0.033% | 0.006% |
| 1986 | 0.018 | 0.000% | 0.032% | 0.006% |
| 1987 | 0.018 | 0.000% | 0.030% | 0.006% |
| 1988 | 0.018 | 0.000% | 0.028% | 0.005% |
| 1989 | 0.018 | 0.000% | 0.027% | 0.005% |
| 1990 | 0.018 | 0.000% | 0.024% | 0.005% |
| 1991 | 0.018 | 0.000% | 0.024% | 0.005% |
| 1992 | 0.018 | 0.000% | 0.024% | 0.005% |
| 1993 | 0.018 | 0.000% | 0.022% | 0.005% |
| 1994 | 0.018 | 0.000% | 0.021% | 0.005% |
| 1995 | 0.018 | 0.000% | 0.020% | 0.005% |
| 1996 | 0.018 | 0.000% | 0.019% | 0.005% |
| 1997 | 0.019 | 5.556% | 0.019% | 0.005% |
| 1998 | 0.019 | 0.000% | 0.019% | 0.005% |
| 1999 | 0.019 | 0.000% | 0.019% | 0.005% |
| 2000 | 0.019 | 0.000% | 0.018% | 0.005% |
| 2001 | 0.019 | 0.000% | 0.017% | 0.005% |
| 2002 | 0.019 | 0.000% | 0.017% | 0.005% |
| 2003 | 0.019 | 0.000% | 0.015% | 0.005% |
| 2004 | 0.019 | 0.000% | 0.014% | 0.004% |
| 2005 | 0.019 | 0.000% | 0.013% | 0.004% |
| 2006 | 0.019 | 0.000% | 0.012% | 0.004% |
| 2007 | 0.020 | 5.263% | 0.012% | 0.004% |
| 2008 | 0.019 | -5.000% | 0.011% | 0.004% |
| 2009 | 0.019 | 0.000% | 0.011% | 0.004% |
| 2010 | 0.019 | 0.000% | 0.010% | 0.004% |
| 2011 | 0.019 | 0.000% | 0.009% | 0.004% |
| 2012 | 0.019 | 0.000% | 0.009% | 0.004% |
| 2013 | 0.019 | 0.000% | 0.009% | 0.004% |
| 2014 | 0.019 | 0.000% | 0.009% | 0.003% |
Historical Energy Data about Wake Island
Total Consumption of Petroleum Products
Oil and Petroleum Products, Net Exports/Imports (-)
Dry Natural Gas, Net Exports/Imports (-)
Coal, Net Exports/Imports (-)
Electricity, Net Exports/Imports (-)
Total Primary Energy Consumption
Total Carbon Dioxide Emissions from the Consumption of Energy