| Business / Energy Data |
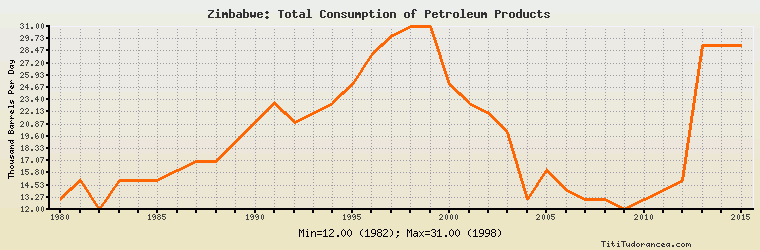
Zimbabwe: Total Consumption of Petroleum Products
Thousand Barrels Per Day
| Year | Zimbabwe | Change, percent | Zimbabwe, percent of Africa | Zimbabwe, percent of World |
| 1980 | 13.000 | N/A | 0.882% | 0.021% |
| 1981 | 15.000 | 15.385% | 0.951% | 0.025% |
| 1982 | 12.000 | -20.000% | 0.723% | 0.020% |
| 1983 | 15.000 | 25.000% | 0.884% | 0.026% |
| 1984 | 15.000 | 0.000% | 0.853% | 0.025% |
| 1985 | 15.000 | 0.000% | 0.821% | 0.025% |
| 1986 | 16.000 | 6.667% | 0.879% | 0.026% |
| 1987 | 17.000 | 6.250% | 0.925% | 0.027% |
| 1988 | 17.000 | 0.000% | 0.892% | 0.026% |
| 1989 | 19.000 | 11.765% | 0.959% | 0.029% |
| 1990 | 21.000 | 10.526% | 1.015% | 0.032% |
| 1991 | 23.000 | 9.524% | 1.086% | 0.034% |
| 1992 | 21.000 | -8.696% | 0.974% | 0.031% |
| 1993 | 22.000 | 4.762% | 1.011% | 0.033% |
| 1994 | 23.000 | 4.545% | 1.053% | 0.033% |
| 1995 | 25.000 | 8.696% | 1.110% | 0.036% |
| 1996 | 28.000 | 12.000% | 1.214% | 0.039% |
| 1997 | 30.000 | 7.143% | 1.264% | 0.041% |
| 1998 | 31.000 | 3.333% | 1.289% | 0.042% |
| 1999 | 31.000 | 0.000% | 1.265% | 0.041% |
| 2000 | 25.000 | -19.355% | 0.977% | 0.032% |
| 2001 | 23.000 | -8.000% | 0.878% | 0.030% |
| 2002 | 22.000 | -4.348% | 0.812% | 0.028% |
| 2003 | 20.000 | -9.091% | 0.726% | 0.025% |
| 2004 | 13.000 | -35.000% | 0.456% | 0.016% |
| 2005 | 16.000 | 23.077% | 0.539% | 0.019% |
| 2006 | 14.000 | -12.500% | 0.465% | 0.016% |
| 2007 | 13.000 | -7.143% | 0.426% | 0.015% |
| 2008 | 13.000 | 0.000% | 0.408% | 0.015% |
| 2009 | 12.000 | -7.692% | 0.359% | 0.014% |
| 2010 | 13.000 | 8.333% | 0.369% | 0.015% |
| 2011 | 14.000 | 7.692% | 0.406% | 0.016% |
| 2012 | 15.000 | 7.143% | 0.412% | 0.016% |
| 2013 | 29.000 | 93.333% | 0.761% | 0.031% |
| 2014 | 29.000 | 0.000% | 0.727% | 0.031% |
| 2015 | 29.000 | 0.000% | 0.725% | 0.030% |
Historical Energy Data about Zimbabwe
Total Consumption of Petroleum Products
Oil and Petroleum Products, Net Exports/Imports (-)
Dry Natural Gas, Net Exports/Imports (-)
Total Primary Coal Production
Total Coal Consumption
Coal, Net Exports/Imports (-)
Total Recoverable Coal
Total Electricity Net Generation
Total Electricity Net Consumption
Total Electricity Exports
Total Electricity Imports
Electricity, Net Exports/Imports (-)
Total Conventional Thermal Electricity Net Generation
Hydroelectricity Net Generation
Total Biofuels Production
Total Primary Energy Production
Total Primary Energy Consumption
Total Carbon Dioxide Emissions from the Consumption of Energy
Population