| Business / Energy Data |
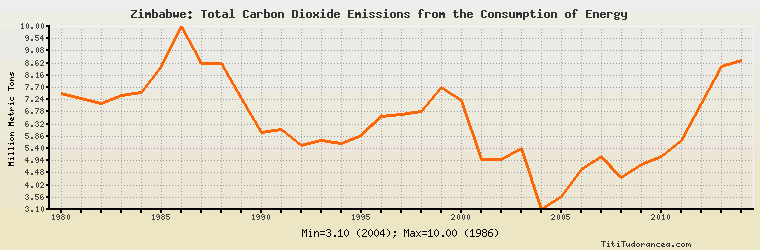
Zimbabwe: Total Carbon Dioxide Emissions from the Consumption of Energy
Million Metric Tons
| Year | Zimbabwe | Change, percent | Zimbabwe, percent of Africa | Zimbabwe, percent of World |
| 1980 | 7.481 | N/A | 1.426% | 0.041% |
| 1981 | 7.300 | -2.419% | 1.403% | 0.040% |
| 1982 | 7.100 | -2.740% | 1.274% | 0.039% |
| 1983 | 7.400 | 4.225% | 1.262% | 0.041% |
| 1984 | 7.500 | 1.351% | 1.221% | 0.039% |
| 1985 | 8.500 | 13.333% | 1.347% | 0.044% |
| 1986 | 10.000 | 17.647% | 1.537% | 0.050% |
| 1987 | 8.600 | -14.000% | 1.284% | 0.042% |
| 1988 | 8.600 | 0.000% | 1.257% | 0.041% |
| 1989 | 7.300 | -15.116% | 1.030% | 0.034% |
| 1990 | 6.000 | -17.808% | 0.812% | 0.028% |
| 1991 | 6.100 | 1.667% | 0.818% | 0.029% |
| 1992 | 5.500 | -9.836% | 0.734% | 0.026% |
| 1993 | 5.700 | 3.636% | 0.738% | 0.027% |
| 1994 | 5.600 | -1.754% | 0.711% | 0.026% |
| 1995 | 5.900 | 5.357% | 0.720% | 0.027% |
| 1996 | 6.600 | 11.864% | 0.782% | 0.029% |
| 1997 | 6.700 | 1.515% | 0.786% | 0.030% |
| 1998 | 6.800 | 1.493% | 0.784% | 0.030% |
| 1999 | 7.700 | 13.235% | 0.893% | 0.034% |
| 2000 | 7.200 | -6.494% | 0.821% | 0.030% |
| 2001 | 5.000 | -30.556% | 0.559% | 0.021% |
| 2002 | 5.000 | 0.000% | 0.541% | 0.020% |
| 2003 | 5.400 | 8.000% | 0.559% | 0.021% |
| 2004 | 3.100 | -42.593% | 0.309% | 0.012% |
| 2005 | 3.600 | 16.129% | 0.348% | 0.013% |
| 2006 | 4.600 | 27.778% | 0.437% | 0.016% |
| 2007 | 5.100 | 10.870% | 0.473% | 0.017% |
| 2008 | 4.300 | -15.686% | 0.382% | 0.014% |
| 2009 | 4.800 | 11.628% | 0.438% | 0.016% |
| 2010 | 5.100 | 6.250% | 0.442% | 0.016% |
| 2011 | 5.700 | 11.765% | 0.499% | 0.018% |
| 2012 | 7.100 | 24.561% | 0.591% | 0.021% |
| 2013 | 8.500 | 19.718% | 0.689% | 0.025% |
| 2014 | 8.700 | 2.353% | 0.686% | 0.026% |
Historical Energy Data about Zimbabwe
Total Consumption of Petroleum Products
Oil and Petroleum Products, Net Exports/Imports (-)
Dry Natural Gas, Net Exports/Imports (-)
Total Primary Coal Production
Total Coal Consumption
Coal, Net Exports/Imports (-)
Total Recoverable Coal
Total Electricity Net Generation
Total Electricity Net Consumption
Total Electricity Exports
Total Electricity Imports
Electricity, Net Exports/Imports (-)
Total Conventional Thermal Electricity Net Generation
Hydroelectricity Net Generation
Total Biofuels Production
Total Primary Energy Production
Total Primary Energy Consumption
Total Carbon Dioxide Emissions from the Consumption of Energy
Population