| Business / Energy Data |
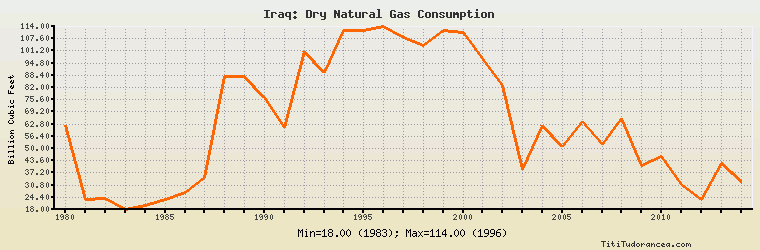
Iraq: Dry Natural Gas Consumption
Billion Cubic Feet
| Year | Iraq | Change, percent | Iraq, percent of Middle East | Iraq, percent of World |
| 1980 | 62.000 | N/A | 4.729% | 0.117% |
| 1981 | 23.000 | -62.903% | 1.770% | 0.043% |
| 1982 | 24.000 | 4.348% | 1.977% | 0.045% |
| 1983 | 18.000 | -25.000% | 1.261% | 0.033% |
| 1984 | 20.000 | 11.111% | 1.052% | 0.034% |
| 1985 | 23.000 | 15.000% | 1.012% | 0.037% |
| 1986 | 27.000 | 17.391% | 1.068% | 0.043% |
| 1987 | 35.000 | 29.630% | 1.195% | 0.053% |
| 1988 | 88.000 | 151.429% | 2.687% | 0.126% |
| 1989 | 88.000 | 0.000% | 2.458% | 0.121% |
| 1990 | 77.000 | -12.500% | 2.140% | 0.105% |
| 1991 | 61.000 | -20.779% | 1.683% | 0.081% |
| 1992 | 101.000 | 65.574% | 2.513% | 0.134% |
| 1993 | 90.000 | -10.891% | 2.105% | 0.117% |
| 1994 | 112.000 | 24.444% | 2.466% | 0.145% |
| 1995 | 112.000 | 0.000% | 2.366% | 0.142% |
| 1996 | 114.000 | 1.786% | 2.162% | 0.141% |
| 1997 | 108.000 | -5.263% | 1.847% | 0.133% |
| 1998 | 104.000 | -3.704% | 1.668% | 0.127% |
| 1999 | 112.000 | 7.692% | 1.736% | 0.134% |
| 2000 | 111.000 | -0.893% | 1.627% | 0.127% |
| 2001 | 97.000 | -12.613% | 1.376% | 0.111% |
| 2002 | 83.000 | -14.433% | 1.083% | 0.091% |
| 2003 | 39.000 | -53.012% | 0.488% | 0.042% |
| 2004 | 62.000 | 58.974% | 0.721% | 0.064% |
| 2005 | 51.000 | -17.742% | 0.519% | 0.051% |
| 2006 | 64.000 | 25.490% | 0.624% | 0.063% |
| 2007 | 52.000 | -18.750% | 0.487% | 0.049% |
| 2008 | 66.000 | 26.923% | 0.566% | 0.060% |
| 2009 | 41.000 | -37.879% | 0.328% | 0.039% |
| 2010 | 46.000 | 12.195% | 0.347% | 0.040% |
| 2011 | 31.000 | -32.609% | 0.221% | 0.026% |
| 2012 | 23.000 | -25.806% | 0.155% | 0.019% |
| 2013 | 42.000 | 82.609% | 0.273% | 0.034% |
| 2014 | 32.000 | -23.810% | 0.199% | 0.026% |
Historical Energy Data about Iraq
Total Oil Supply
Total Consumption of Petroleum Products
Oil and Petroleum Products, Net Exports/Imports (-)
Production of Crude Oil including Lease Condensate
Crude Oil Proved Reserves
Dry Natural Gas Production
Dry Natural Gas Consumption
Dry Natural Gas, Net Exports/Imports (-)
Proved Reserves of Natural Gas
Total Coal Consumption
Coal, Net Exports/Imports (-)
Total Electricity Net Generation
Total Electricity Net Consumption
Total Electricity Imports
Electricity, Net Exports/Imports (-)
Total Conventional Thermal Electricity Net Generation
Hydroelectricity Net Generation
Total Primary Energy Production
Total Primary Energy Consumption
Total Carbon Dioxide Emissions from the Consumption of Energy
Population