| Business / Energy Data |
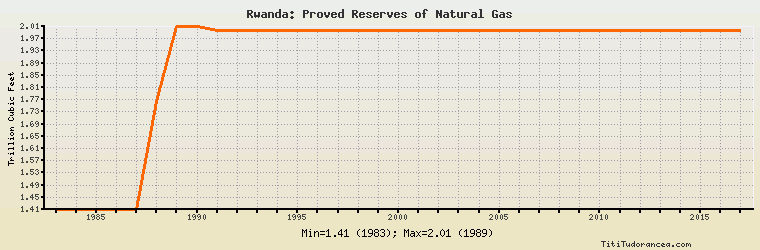
Rwanda: Proved Reserves of Natural Gas
Trillion Cubic Feet
| Year | Rwanda | Change, percent | Rwanda, percent of Africa | Rwanda, percent of World |
| 1980 | N/A | N/A | N/A | N/A |
| 1981 | N/A | N/A | N/A | N/A |
| 1982 | N/A | N/A | N/A | N/A |
| 1983 | 1.413 | N/A | 0.740% | 0.047% |
| 1984 | 1.413 | 0.000% | 0.730% | 0.044% |
| 1985 | 1.413 | 0.000% | 0.739% | 0.042% |
| 1986 | 1.413 | 0.000% | 0.695% | 0.041% |
| 1987 | 1.413 | 0.000% | 0.672% | 0.039% |
| 1988 | 1.766 | 24.982% | 0.692% | 0.047% |
| 1989 | 2.013 | 13.986% | 0.783% | 0.051% |
| 1990 | 2.013 | 0.000% | 0.741% | 0.051% |
| 1991 | 2.000 | -0.646% | 0.690% | 0.047% |
| 1992 | 2.000 | 0.000% | 0.643% | 0.076% |
| 1993 | 2.000 | 0.000% | 0.575% | 0.068% |
| 1994 | 2.000 | 0.000% | 0.582% | 0.066% |
| 1995 | 2.000 | 0.000% | 0.585% | 0.067% |
| 1996 | 2.000 | 0.000% | 0.598% | 0.068% |
| 1997 | 2.000 | 0.000% | 0.608% | 0.040% |
| 1998 | 2.000 | 0.000% | 0.573% | 0.039% |
| 1999 | 2.000 | 0.000% | 0.554% | 0.039% |
| 2000 | 2.000 | 0.000% | 0.507% | 0.039% |
| 2001 | 2.000 | 0.000% | 0.507% | 0.038% |
| 2002 | 2.000 | 0.000% | 0.506% | 0.037% |
| 2003 | 2.000 | 0.000% | 0.478% | 0.036% |
| 2004 | 2.000 | 0.000% | 0.441% | 0.033% |
| 2005 | 2.000 | 0.000% | 0.419% | 0.033% |
| 2006 | 2.000 | 0.000% | 0.411% | 0.033% |
| 2007 | 2.000 | 0.000% | 0.412% | 0.032% |
| 2008 | 2.000 | 0.000% | 0.408% | 0.032% |
| 2009 | 2.000 | 0.000% | 0.404% | 0.032% |
| 2010 | 2.000 | 0.000% | 0.403% | 0.030% |
| 2011 | 2.000 | 0.000% | 0.386% | 0.030% |
| 2012 | 2.000 | 0.000% | 0.392% | 0.029% |
| 2013 | 2.000 | 0.000% | 0.389% | 0.029% |
| 2014 | 2.000 | 0.000% | 0.330% | 0.029% |
| 2015 | 2.000 | 0.000% | 0.331% | 0.029% |
| 2016 | 2.000 | 0.000% | 0.330% | 0.029% |
| 2017 | 2.000 | 0.000% | 0.327% | N/A |
Historical Energy Data about Rwanda
Total Consumption of Petroleum Products
Oil and Petroleum Products, Net Exports/Imports (-)
Dry Natural Gas, Net Exports/Imports (-)
Proved Reserves of Natural Gas
Coal, Net Exports/Imports (-)
Total Electricity Net Generation
Total Electricity Net Consumption
Total Electricity Exports
Total Electricity Imports
Electricity, Net Exports/Imports (-)
Total Conventional Thermal Electricity Net Generation
Hydroelectricity Net Generation
Total Primary Energy Production
Total Primary Energy Consumption
Total Carbon Dioxide Emissions from the Consumption of Energy
Population