| Business / Demographics |
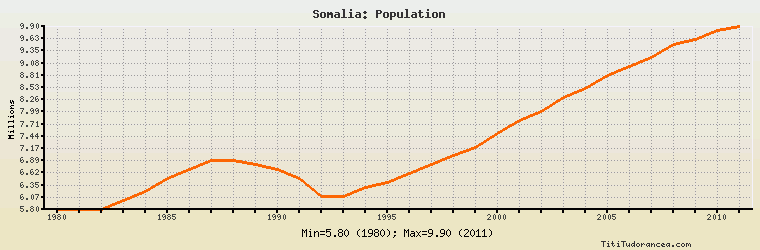
Somalia: Population
Millions
| Year | Somalia | Change, percent | Somalia, percent of Africa | Somalia, percent of World |
| 1980 | 5.800 | N/A | 1.222% | 0.130% |
| 1981 | 5.800 | 0.000% | 1.189% | 0.128% |
| 1982 | 5.800 | 0.000% | 1.144% | 0.126% |
| 1983 | 6.000 | 3.448% | 1.155% | 0.128% |
| 1984 | 6.200 | 3.333% | 1.165% | 0.130% |
| 1985 | 6.500 | 4.839% | 1.186% | 0.134% |
| 1986 | 6.700 | 3.077% | 1.191% | 0.136% |
| 1987 | 6.900 | 2.985% | 1.193% | 0.137% |
| 1988 | 6.900 | 0.000% | 1.159% | 0.135% |
| 1989 | 6.800 | -1.449% | 1.112% | 0.131% |
| 1990 | 6.700 | -1.471% | 1.067% | 0.127% |
| 1991 | 6.500 | -2.985% | 1.010% | 0.121% |
| 1992 | 6.100 | -6.154% | 0.924% | 0.112% |
| 1993 | 6.100 | 0.000% | 0.902% | 0.110% |
| 1994 | 6.300 | 3.279% | 0.905% | 0.112% |
| 1995 | 6.400 | 1.587% | 0.896% | 0.112% |
| 1996 | 6.600 | 3.125% | 0.903% | 0.114% |
| 1997 | 6.800 | 3.030% | 0.910% | 0.116% |
| 1998 | 7.000 | 2.941% | 0.915% | 0.118% |
| 1999 | 7.200 | 2.857% | 0.918% | 0.120% |
| 2000 | 7.500 | 4.167% | 0.932% | 0.123% |
| 2001 | 7.800 | 4.000% | 0.949% | 0.127% |
| 2002 | 8.000 | 2.564% | 0.947% | 0.128% |
| 2003 | 8.300 | 3.750% | 0.960% | 0.131% |
| 2004 | 8.500 | 2.410% | 0.958% | 0.133% |
| 2005 | 8.800 | 3.529% | 0.968% | 0.136% |
| 2006 | 9.000 | 2.273% | 0.965% | 0.137% |
| 2007 | 9.200 | 2.222% | 0.966% | 0.139% |
| 2008 | 9.500 | 3.261% | 0.974% | 0.142% |
| 2009 | 9.600 | 1.053% | 0.959% | 0.141% |
| 2010 | 9.800 | 2.083% | 0.955% | 0.143% |
| 2011 | 9.900 | 1.020% | 0.940% | 0.142% |
Historical Energy Data about Somalia
Total Oil Supply
Total Consumption of Petroleum Products
Oil and Petroleum Products, Net Exports/Imports (-)
Dry Natural Gas, Net Exports/Imports (-)
Proved Reserves of Natural Gas
Coal, Net Exports/Imports (-)
Total Electricity Net Generation
Total Electricity Net Consumption
Electricity, Net Exports/Imports (-)
Total Conventional Thermal Electricity Net Generation
Total Primary Energy Consumption
Total Carbon Dioxide Emissions from the Consumption of Energy
Population