| Business / Energy Data |
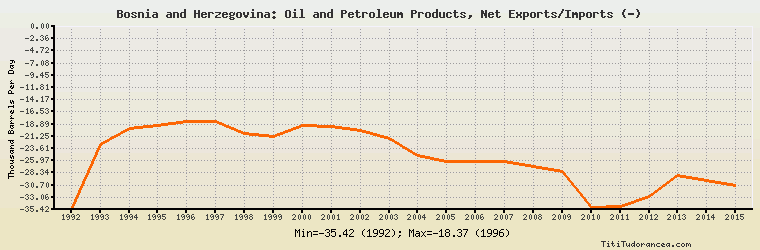
Bosnia and Herzegovina: Oil and Petroleum Products, Net Exports/Imports (-)
Thousand Barrels Per Day
| Year | Bosnia and Herzegovina | Change, percent | Bosnia and Herzegovina, percent of Europe | Bosnia and Herzegovina, percent of World |
| 1992 | -35.420 | N/A | 0.368% | N/A |
| 1993 | -22.859 | -35.463% | 0.245% | N/A |
| 1994 | -19.659 | -13.999% | 0.231% | N/A |
| 1995 | -19.101 | -2.838% | 0.225% | N/A |
| 1996 | -18.371 | -3.822% | 0.219% | N/A |
| 1997 | -18.446 | 0.408% | 0.215% | N/A |
| 1998 | -20.738 | 12.425% | 0.232% | N/A |
| 1999 | -21.362 | 3.009% | 0.245% | N/A |
| 2000 | -19.232 | -9.971% | 0.220% | N/A |
| 2001 | -19.284 | 0.270% | 0.217% | N/A |
| 2002 | -20.126 | 4.366% | 0.226% | N/A |
| 2003 | -21.768 | 8.159% | 0.236% | N/A |
| 2004 | -24.941 | 14.576% | 0.257% | N/A |
| 2005 | -26.047 | 4.434% | 0.256% | N/A |
| 2006 | -26.073 | 0.100% | 0.245% | N/A |
| 2007 | -26.059 | -0.054% | 0.242% | N/A |
| 2008 | -27.097 | 3.983% | 0.248% | N/A |
| 2009 | -28.094 | 3.679% | 0.271% | N/A |
| 2010 | -35.013 | 24.628% | 0.326% | N/A |
| 2011 | -34.926 | -0.248% | 0.330% | N/A |
| 2012 | -32.865 | -5.901% | 0.316% | N/A |
| 2013 | -28.865 | -12.171% | 0.276% | N/A |
| 2014 | -29.865 | 3.464% | 0.290% | N/A |
| 2015 | -30.865 | 3.348% | 0.298% | N/A |
Historical Energy Data about Bosnia and Herzegovina
Total Oil Supply
Total Consumption of Petroleum Products
Oil and Petroleum Products, Net Exports/Imports (-)
Dry Natural Gas Production
Dry Natural Gas Consumption
Dry Natural Gas, Net Exports/Imports (-)
Total Primary Coal Production
Total Coal Consumption
Coal, Net Exports/Imports (-)
Total Electricity Net Generation
Total Electricity Net Consumption
Total Electricity Exports
Total Electricity Imports
Electricity, Net Exports/Imports (-)
Total Conventional Thermal Electricity Net Generation
Hydroelectricity Net Generation
Total Primary Energy Production
Total Primary Energy Consumption
Total Carbon Dioxide Emissions from the Consumption of Energy
Population