| Business / Energy Data |
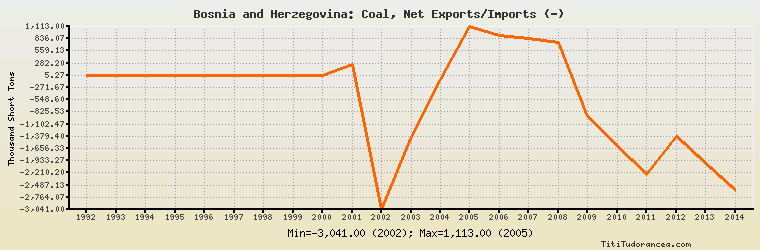
Bosnia and Herzegovina: Coal, Net Exports/Imports (-)
Thousand Short Tons
| Year | Bosnia and Herzegovina | Change, percent | Bosnia and Herzegovina, percent of Europe | Bosnia and Herzegovina, percent of World |
| 1992 | 0.000 | N/A | 0.00% | N/A |
| 1993 | 0.000 | 0.000% | 0.00% | N/A |
| 1994 | 0.000 | 0.000% | 0.00% | N/A |
| 1995 | 0.000 | 0.000% | 0.00% | N/A |
| 1996 | 0.000 | 0.000% | 0.00% | N/A |
| 1997 | 0.000 | 0.000% | 0.00% | N/A |
| 1998 | 0.000 | 0.000% | 0.00% | N/A |
| 1999 | 0.000 | 0.000% | 0.00% | N/A |
| 2000 | 2.000 | 0.000% | -0.001% | N/A |
| 2001 | 248.000 | 12,300.000% | -0.125% | N/A |
| 2002 | -3,041.000 | -1,326.210% | 1.528% | N/A |
| 2003 | -1,376.000 | -54.752% | 0.600% | N/A |
| 2004 | -96.000 | -93.023% | 0.041% | N/A |
| 2005 | 1,113.000 | -1,259.375% | -0.475% | N/A |
| 2006 | 913.000 | -17.969% | -0.353% | N/A |
| 2007 | 841.000 | -7.886% | -0.310% | N/A |
| 2008 | 743.000 | -11.653% | -0.314% | N/A |
| 2009 | -930.000 | -225.168% | 0.467% | N/A |
| 2010 | -1,615.000 | 73.656% | 0.702% | N/A |
| 2011 | -2,236.000 | 38.452% | 0.928% | N/A |
| 2012 | -1,373.000 | -38.596% | 0.535% | N/A |
| 2013 | -1,990.000 | 44.938% | 0.759% | N/A |
| 2014 | -2,603.000 | 30.804% | 1.049% | N/A |
Historical Energy Data about Bosnia and Herzegovina
Total Oil Supply
Total Consumption of Petroleum Products
Oil and Petroleum Products, Net Exports/Imports (-)
Dry Natural Gas Production
Dry Natural Gas Consumption
Dry Natural Gas, Net Exports/Imports (-)
Total Primary Coal Production
Total Coal Consumption
Coal, Net Exports/Imports (-)
Total Electricity Net Generation
Total Electricity Net Consumption
Total Electricity Exports
Total Electricity Imports
Electricity, Net Exports/Imports (-)
Total Conventional Thermal Electricity Net Generation
Hydroelectricity Net Generation
Total Primary Energy Production
Total Primary Energy Consumption
Total Carbon Dioxide Emissions from the Consumption of Energy
Population