| Business / Energy Data |
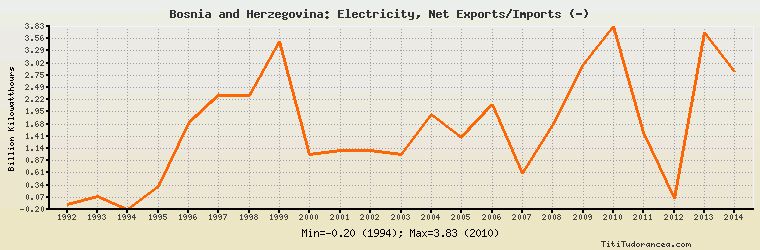
Bosnia and Herzegovina: Electricity, Net Exports/Imports (-)
Billion Kilowatthours
| Year | Bosnia and Herzegovina | Change, percent | Bosnia and Herzegovina, percent of Europe | Bosnia and Herzegovina, percent of World |
| 1992 | -0.100 | N/A | 0.896% | N/A |
| 1993 | 0.088 | -188.000% | -0.844% | N/A |
| 1994 | -0.200 | -327.273% | 2.048% | N/A |
| 1995 | 0.300 | -250.000% | -4.617% | N/A |
| 1996 | 1.700 | 466.667% | -23.304% | N/A |
| 1997 | 2.300 | 35.294% | -35.157% | N/A |
| 1998 | 2.300 | 0.000% | -22.879% | N/A |
| 1999 | 3.500 | 52.174% | -89.127% | N/A |
| 2000 | 1.000 | -71.429% | -17.857% | N/A |
| 2001 | 1.100 | 10.000% | -8.460% | N/A |
| 2002 | 1.100 | 0.000% | -7.440% | N/A |
| 2003 | 1.000 | -9.091% | -6.304% | N/A |
| 2004 | 1.900 | 90.000% | -16.055% | N/A |
| 2005 | 1.377 | -27.526% | -11.518% | N/A |
| 2006 | 2.108 | 53.086% | -20.397% | N/A |
| 2007 | 0.601 | -71.490% | -5.786% | N/A |
| 2008 | 1.645 | 173.710% | -12.966% | N/A |
| 2009 | 2.990 | 81.763% | -31.603% | N/A |
| 2010 | 3.829 | 28.060% | -47.219% | N/A |
| 2011 | 1.489 | -61.113% | -15.562% | N/A |
| 2012 | 0.044 | -97.045% | -1.439% | N/A |
| 2013 | 3.695 | 8,297.727% | -116.341% | N/A |
| 2014 | 2.836 | -23.248% | 159.415% | N/A |
Historical Energy Data about Bosnia and Herzegovina
Total Oil Supply
Total Consumption of Petroleum Products
Oil and Petroleum Products, Net Exports/Imports (-)
Dry Natural Gas Production
Dry Natural Gas Consumption
Dry Natural Gas, Net Exports/Imports (-)
Total Primary Coal Production
Total Coal Consumption
Coal, Net Exports/Imports (-)
Total Electricity Net Generation
Total Electricity Net Consumption
Total Electricity Exports
Total Electricity Imports
Electricity, Net Exports/Imports (-)
Total Conventional Thermal Electricity Net Generation
Hydroelectricity Net Generation
Total Primary Energy Production
Total Primary Energy Consumption
Total Carbon Dioxide Emissions from the Consumption of Energy
Population