| Business / Energy Data |
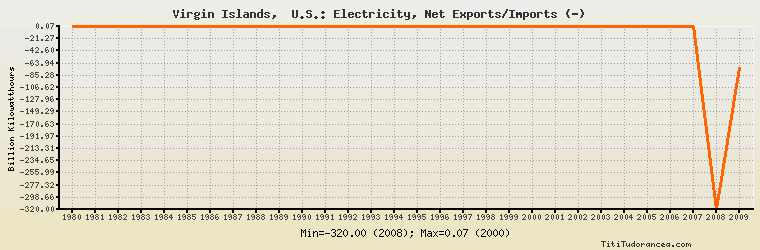
Virgin Islands, U.S.: Electricity, Net Exports/Imports (-)
Billion Kilowatthours
| Year | Virgin Islands, U.S. | Change, percent | Virgin Islands, U.S., percent of Central & South America | Virgin Islands, U.S., percent of World |
| 1980 | 0.052 | N/A | 52.000% | N/A |
| 1981 | 0.055 | 5.769% | 39.007% | N/A |
| 1982 | 0.056 | 1.818% | -44.444% | N/A |
| 1983 | 0.058 | 3.571% | 25.439% | N/A |
| 1984 | 0.058 | 0.000% | 61.053% | N/A |
| 1985 | 0.059 | 1.724% | 2.206% | N/A |
| 1986 | 0.061 | 3.390% | 48.031% | N/A |
| 1987 | 0.063 | 3.279% | 13.180% | N/A |
| 1988 | 0.064 | 1.587% | 41.290% | N/A |
| 1989 | 0.063 | -1.563% | -4.440% | N/A |
| 1990 | 0.064 | 1.587% | 46.377% | N/A |
| 1991 | 0.066 | 3.125% | 33.846% | N/A |
| 1992 | 0.067 | 1.515% | 1,340.000% | N/A |
| 1993 | 0.068 | 1.493% | - | N/A |
| 1994 | 0.070 | 2.941% | - | N/A |
| 1995 | 0.070 | 0.000% | 179.487% | N/A |
| 1996 | 0.071 | 1.429% | -2.643% | N/A |
| 1997 | 0.071 | 0.000% | 58.678% | N/A |
| 1998 | 0.071 | 0.000% | -43.827% | N/A |
| 1999 | 0.071 | 0.000% | 253.571% | N/A |
| 2000 | 0.072 | 1.408% | 5.560% | N/A |
| 2001 | 0.068 | -5.556% | -6.532% | N/A |
| 2002 | 0.068 | 0.000% | 174.359% | N/A |
| 2003 | 0.068 | 0.000% | 10.398% | N/A |
| 2004 | 0.069 | 1.471% | -16.235% | N/A |
| 2005 | 0.070 | 1.449% | -4.560% | N/A |
| 2006 | 0.070 | 0.000% | -5.113% | N/A |
| 2007 | 0.054 | -22.857% | -2.254% | N/A |
| 2008 | -320.000 | -592,692.593% | 14,165.560% | N/A |
| 2009 | -71.953 | -77.515% | 1,913.644% | N/A |
Historical Energy Data about Virgin Islands, U.S.
Total Oil Supply
Total Consumption of Petroleum Products
Oil and Petroleum Products, Net Exports/Imports (-)
Dry Natural Gas, Net Exports/Imports (-)
Total Coal Consumption
Coal, Net Exports/Imports (-)
Total Electricity Net Generation
Total Electricity Net Consumption
Electricity, Net Exports/Imports (-)
Total Conventional Thermal Electricity Net Generation
Total Biofuels Production
Total Primary Energy Consumption
Total Carbon Dioxide Emissions from the Consumption of Energy
Population