| Business / Energy Data |
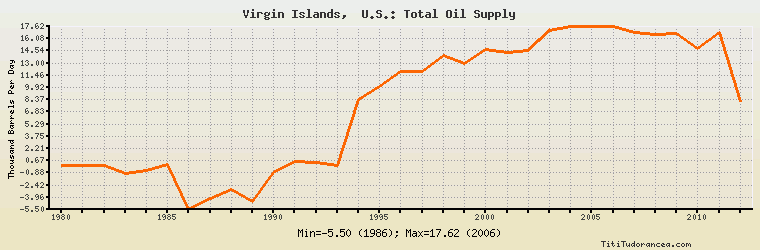
Virgin Islands, U.S.: Total Oil Supply
Thousand Barrels Per Day
| Year | Virgin Islands, U.S. | Change, percent | Virgin Islands, U.S., percent of Central & South America | Virgin Islands, U.S., percent of World |
| 1980 | 0.000 | N/A | 0.00% | 0.00% |
| 1981 | 0.000 | 0.000% | 0.00% | 0.00% |
| 1982 | 0.000 | 0.000% | 0.00% | 0.00% |
| 1983 | -1.000 | 0.000% | -0.027% | -0.002% |
| 1984 | -0.600 | -40.000% | -0.015% | -0.001% |
| 1985 | 0.200 | -133.333% | 0.005% | 0.000% |
| 1986 | -5.500 | -2,850.000% | -0.133% | -0.009% |
| 1987 | -4.100 | -25.455% | -0.101% | -0.007% |
| 1988 | -3.000 | -26.829% | -0.069% | -0.005% |
| 1989 | -4.500 | 50.000% | -0.103% | -0.007% |
| 1990 | -0.800 | -82.222% | -0.017% | -0.001% |
| 1991 | 0.600 | -175.000% | 0.012% | 0.001% |
| 1992 | 0.400 | -33.333% | 0.008% | 0.001% |
| 1993 | 0.100 | -75.000% | 0.002% | 0.000% |
| 1994 | 8.400 | 8,300.000% | 0.148% | 0.012% |
| 1995 | 10.000 | 19.048% | 0.163% | 0.014% |
| 1996 | 12.000 | 20.000% | 0.184% | 0.017% |
| 1997 | 12.000 | 0.000% | 0.171% | 0.016% |
| 1998 | 14.000 | 16.667% | 0.197% | 0.018% |
| 1999 | 13.000 | -7.143% | 0.186% | 0.017% |
| 2000 | 14.683 | 12.946% | 0.201% | 0.019% |
| 2001 | 14.335 | -2.370% | 0.199% | 0.018% |
| 2002 | 14.652 | 2.211% | 0.211% | 0.019% |
| 2003 | 17.111 | 16.783% | 0.256% | 0.021% |
| 2004 | 17.619 | 2.969% | 0.251% | 0.021% |
| 2005 | 17.579 | -0.227% | 0.243% | 0.021% |
| 2006 | 17.623 | 0.250% | 0.242% | 0.021% |
| 2007 | 16.868 | -4.284% | 0.232% | 0.020% |
| 2008 | 16.645 | -1.322% | 0.222% | 0.019% |
| 2009 | 16.767 | 0.733% | 0.217% | 0.020% |
| 2010 | 14.838 | -11.505% | 0.189% | 0.017% |
| 2011 | 16.812 | 13.304% | 0.209% | 0.019% |
| 2012 | 8.088 | -51.892% | 0.101% | 0.009% |
Historical Energy Data about Virgin Islands, U.S.
Total Oil Supply
Total Consumption of Petroleum Products
Oil and Petroleum Products, Net Exports/Imports (-)
Dry Natural Gas, Net Exports/Imports (-)
Total Coal Consumption
Coal, Net Exports/Imports (-)
Total Electricity Net Generation
Total Electricity Net Consumption
Electricity, Net Exports/Imports (-)
Total Conventional Thermal Electricity Net Generation
Total Biofuels Production
Total Primary Energy Consumption
Total Carbon Dioxide Emissions from the Consumption of Energy
Population