| Business / Energy Data |
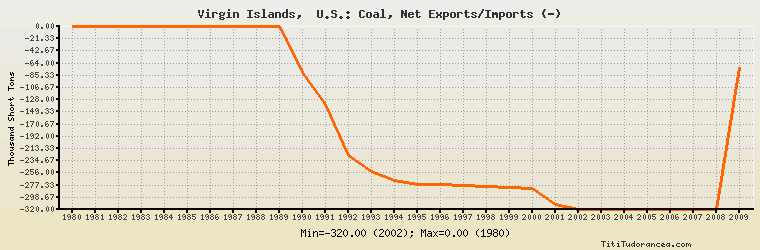
Virgin Islands, U.S.: Coal, Net Exports/Imports (-)
Thousand Short Tons
| Year | Virgin Islands, U.S. | Change, percent | Virgin Islands, U.S., percent of Central & South America | Virgin Islands, U.S., percent of World |
| 1980 | 0.000 | N/A | 0.00% | N/A |
| 1981 | 0.000 | 0.000% | 0.00% | N/A |
| 1982 | 0.000 | 0.000% | 0.00% | N/A |
| 1983 | 0.000 | 0.000% | 0.00% | N/A |
| 1984 | 0.000 | 0.000% | 0.00% | N/A |
| 1985 | 0.000 | 0.000% | 0.00% | N/A |
| 1986 | 0.000 | 0.000% | 0.00% | N/A |
| 1987 | 0.000 | 0.000% | 0.00% | N/A |
| 1988 | 0.000 | 0.000% | 0.00% | N/A |
| 1989 | 0.000 | 0.000% | 0.00% | N/A |
| 1990 | -80.000 | 0.000% | -1.597% | N/A |
| 1991 | -136.000 | 70.000% | -4.206% | N/A |
| 1992 | -226.000 | 66.176% | -4.386% | N/A |
| 1993 | -254.000 | 12.389% | -5.468% | N/A |
| 1994 | -270.000 | 6.299% | -4.171% | N/A |
| 1995 | -276.000 | 2.222% | -3.243% | N/A |
| 1996 | -276.000 | 0.000% | -2.382% | N/A |
| 1997 | -278.000 | 0.725% | -1.900% | N/A |
| 1998 | -280.000 | 0.719% | -1.464% | N/A |
| 1999 | -281.000 | 0.357% | -1.794% | N/A |
| 2000 | -283.000 | 0.712% | -1.241% | N/A |
| 2001 | -312.000 | 10.247% | -1.033% | N/A |
| 2002 | -320.000 | 2.564% | -1.209% | N/A |
| 2003 | -320.000 | 0.000% | -0.908% | N/A |
| 2004 | -320.000 | 0.000% | -0.860% | N/A |
| 2005 | -320.000 | 0.000% | -0.738% | N/A |
| 2006 | -320.000 | 0.000% | -0.654% | N/A |
| 2007 | -320.000 | 0.000% | -0.628% | N/A |
| 2008 | -320.000 | 0.000% | -0.599% | N/A |
| 2009 | -71.953 | -77.515% | -0.137% | N/A |
Historical Energy Data about Virgin Islands, U.S.
Total Oil Supply
Total Consumption of Petroleum Products
Oil and Petroleum Products, Net Exports/Imports (-)
Dry Natural Gas, Net Exports/Imports (-)
Total Coal Consumption
Coal, Net Exports/Imports (-)
Total Electricity Net Generation
Total Electricity Net Consumption
Electricity, Net Exports/Imports (-)
Total Conventional Thermal Electricity Net Generation
Total Biofuels Production
Total Primary Energy Consumption
Total Carbon Dioxide Emissions from the Consumption of Energy
Population