| Business / Energy Data |
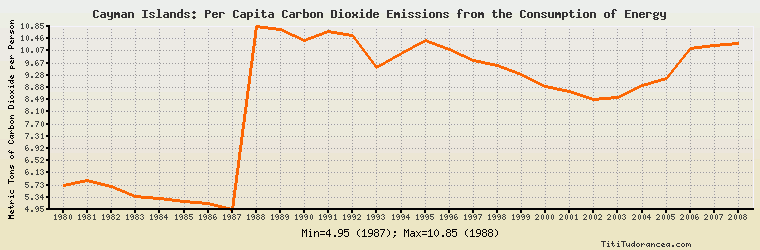
Cayman Islands: Per Capita Carbon Dioxide Emissions from the Consumption of Energy
Metric Tons of Carbon Dioxide per Person
| Year | Cayman Islands | Change, percent | Cayman Islands, percent of Central & South America | Cayman Islands, percent of World |
| 1980 | 5.725 | N/A | N/A | 137.852% |
| 1981 | 5.892 | 2.917% | N/A | 146.095% |
| 1982 | 5.697 | -3.310% | N/A | 144.631% |
| 1983 | 5.372 | -5.705% | N/A | 137.779% |
| 1984 | 5.285 | -1.620% | N/A | 131.500% |
| 1985 | 5.215 | -1.325% | N/A | 129.020% |
| 1986 | 5.133 | -1.572% | N/A | 126.304% |
| 1987 | 4.946 | -3.643% | N/A | 120.693% |
| 1988 | 10.854 | 119.450% | N/A | 260.788% |
| 1989 | 10.764 | -0.829% | N/A | 259.311% |
| 1990 | 10.411 | -3.279% | N/A | 253.679% |
| 1991 | 10.708 | 2.853% | N/A | 266.368% |
| 1992 | 10.549 | -1.485% | N/A | 267.673% |
| 1993 | 9.545 | -9.517% | N/A | 243.123% |
| 1994 | 9.969 | 4.442% | N/A | 255.812% |
| 1995 | 10.397 | 4.293% | N/A | 266.385% |
| 1996 | 10.100 | -2.857% | N/A | 256.606% |
| 1997 | 9.755 | -3.416% | N/A | 246.712% |
| 1998 | 9.607 | -1.517% | N/A | 246.903% |
| 1999 | 9.301 | -3.185% | N/A | 238.916% |
| 2000 | 8.932 | -3.967% | N/A | 227.625% |
| 2001 | 8.745 | -2.094% | N/A | 224.173% |
| 2002 | 8.493 | -2.882% | N/A | 213.983% |
| 2003 | 8.556 | 0.742% | N/A | 207.922% |
| 2004 | 8.947 | 4.570% | N/A | 206.867% |
| 2005 | 9.176 | 2.560% | N/A | 208.261% |
| 2006 | 10.159 | 10.713% | N/A | 228.703% |
| 2007 | 10.241 | 0.807% | N/A | 226.721% |
| 2008 | 10.293 | 0.508% | N/A | 226.718% |
| 2009 | N/A | N/A | N/A | N/A |
| 2010 | N/A | N/A | N/A | N/A |
Historical Energy Data about Cayman Islands
Total Consumption of Petroleum Products
Oil and Petroleum Products, Net Exports/Imports (-)
Dry Natural Gas, Net Exports/Imports (-)
Coal, Net Exports/Imports (-)
Total Electricity Net Generation
Total Electricity Net Consumption
Electricity, Net Exports/Imports (-)
Total Conventional Thermal Electricity Net Generation
Total Primary Energy Consumption
Total Carbon Dioxide Emissions from the Consumption of Energy
Population