| Business / Energy Data |
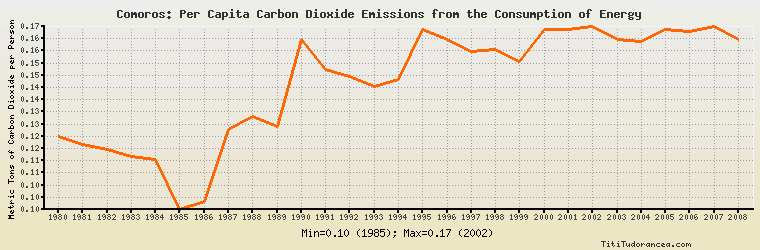
Comoros: Per Capita Carbon Dioxide Emissions from the Consumption of Energy
Metric Tons of Carbon Dioxide per Person
| Year | Comoros | Change, percent | Comoros, percent of Africa | Comoros, percent of World |
| 1980 | 0.124 | N/A | N/A | 2.986% |
| 1981 | 0.121 | -2.419% | N/A | 3.000% |
| 1982 | 0.119 | -1.653% | N/A | 3.021% |
| 1983 | 0.116 | -2.521% | N/A | 2.975% |
| 1984 | 0.115 | -0.862% | N/A | 2.861% |
| 1985 | 0.095 | -17.391% | N/A | 2.350% |
| 1986 | 0.098 | 3.158% | N/A | 2.411% |
| 1987 | 0.127 | 29.592% | N/A | 3.099% |
| 1988 | 0.132 | 3.937% | N/A | 3.172% |
| 1989 | 0.128 | -3.030% | N/A | 3.084% |
| 1990 | 0.163 | 27.344% | N/A | 3.972% |
| 1991 | 0.151 | -7.362% | N/A | 3.756% |
| 1992 | 0.148 | -1.987% | N/A | 3.755% |
| 1993 | 0.144 | -2.703% | N/A | 3.668% |
| 1994 | 0.147 | 2.083% | N/A | 3.772% |
| 1995 | 0.167 | 13.605% | N/A | 4.279% |
| 1996 | 0.163 | -2.395% | N/A | 4.141% |
| 1997 | 0.158 | -3.067% | N/A | 3.996% |
| 1998 | 0.159 | 0.633% | N/A | 4.086% |
| 1999 | 0.154 | -3.145% | N/A | 3.956% |
| 2000 | 0.167 | 8.442% | N/A | 4.256% |
| 2001 | 0.167 | 0.000% | N/A | 4.281% |
| 2002 | 0.168 | 0.599% | N/A | 4.233% |
| 2003 | 0.163 | -2.976% | N/A | 3.961% |
| 2004 | 0.162 | -0.613% | N/A | 3.746% |
| 2005 | 0.167 | 3.086% | N/A | 3.790% |
| 2006 | 0.166 | -0.599% | N/A | 3.737% |
| 2007 | 0.168 | 1.205% | N/A | 3.719% |
| 2008 | 0.163 | -2.976% | N/A | 3.590% |
| 2009 | N/A | N/A | N/A | N/A |
| 2010 | N/A | N/A | N/A | N/A |
Historical Energy Data about Comoros
Total Consumption of Petroleum Products
Oil and Petroleum Products, Net Exports/Imports (-)
Dry Natural Gas, Net Exports/Imports (-)
Coal, Net Exports/Imports (-)
Total Electricity Net Generation
Total Electricity Net Consumption
Electricity, Net Exports/Imports (-)
Total Conventional Thermal Electricity Net Generation
Hydroelectricity Net Generation
Total Primary Energy Consumption
Total Carbon Dioxide Emissions from the Consumption of Energy
Population