| Business / Energy Data |
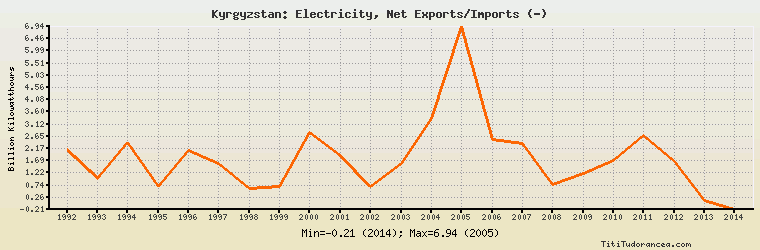
Kyrgyzstan: Electricity, Net Exports/Imports (-)
Billion Kilowatthours
| Year | Kyrgyzstan | Change, percent | Kyrgyzstan, percent of Eurasia | Kyrgyzstan, percent of World |
| 1992 | 2.100 | N/A | 18.819% | N/A |
| 1993 | 1.000 | -52.381% | 12.571% | N/A |
| 1994 | 2.400 | 140.000% | 18.005% | N/A |
| 1995 | 0.700 | -70.833% | 7.426% | N/A |
| 1996 | 2.100 | 200.000% | 19.499% | N/A |
| 1997 | 1.600 | -23.810% | 18.340% | N/A |
| 1998 | 0.600 | -62.500% | 5.772% | N/A |
| 1999 | 0.700 | 16.667% | 9.315% | N/A |
| 2000 | 2.800 | 300.000% | 44.262% | N/A |
| 2001 | 1.900 | -32.143% | 11.938% | N/A |
| 2002 | 0.700 | -63.158% | 9.223% | N/A |
| 2003 | 1.600 | 128.571% | 8.603% | N/A |
| 2004 | 3.346 | 109.125% | 18.434% | N/A |
| 2005 | 6.940 | 107.412% | 38.231% | N/A |
| 2006 | 2.512 | -63.804% | 13.182% | N/A |
| 2007 | 2.375 | -5.454% | 12.058% | N/A |
| 2008 | 0.766 | -67.747% | 3.676% | N/A |
| 2009 | 1.199 | 56.527% | 6.028% | N/A |
| 2010 | 1.712 | 42.786% | 9.049% | N/A |
| 2011 | 2.674 | 56.192% | 13.842% | N/A |
| 2012 | 1.663 | -37.809% | 8.612% | N/A |
| 2013 | 0.147 | -91.161% | 0.851% | N/A |
| 2014 | -0.214 | -245.578% | -1.770% | N/A |
Historical Energy Data about Kyrgyzstan
Total Oil Supply
Total Consumption of Petroleum Products
Oil and Petroleum Products, Net Exports/Imports (-)
Production of Crude Oil including Lease Condensate
Crude Oil Proved Reserves
Dry Natural Gas Production
Dry Natural Gas Consumption
Dry Natural Gas, Net Exports/Imports (-)
Proved Reserves of Natural Gas
Total Primary Coal Production
Total Coal Consumption
Coal, Net Exports/Imports (-)
Total Recoverable Coal
Total Electricity Net Generation
Total Electricity Net Consumption
Total Electricity Exports
Total Electricity Imports
Electricity, Net Exports/Imports (-)
Total Conventional Thermal Electricity Net Generation
Hydroelectricity Net Generation
Total Primary Energy Production
Total Primary Energy Consumption
Total Carbon Dioxide Emissions from the Consumption of Energy
Population