| Business / Energy Data |
Azerbaijan: Electricity, Net Exports/Imports (-)
Billion Kilowatthours
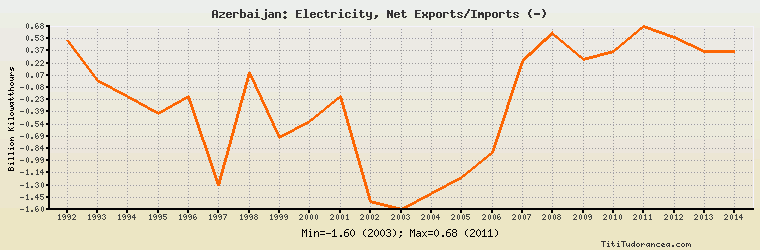
| Year | Azerbaijan | Change, percent | Azerbaijan, percent of Eurasia | Azerbaijan, percent of World |
| 1992 | 0.500 | N/A | 4.481% | N/A |
| 1993 | 0.000 | -100.000% | 0.00% | N/A |
| 1994 | -0.200 | 0.000% | -1.500% | N/A |
| 1995 | -0.400 | 100.000% | -4.244% | N/A |
| 1996 | -0.200 | -50.000% | -1.857% | N/A |
| 1997 | -1.300 | 550.000% | -14.901% | N/A |
| 1998 | 0.100 | -107.692% | 0.962% | N/A |
| 1999 | -0.700 | -800.000% | -9.315% | N/A |
| 2000 | -0.500 | -28.571% | -7.904% | N/A |
| 2001 | -0.200 | -60.000% | -1.257% | N/A |
| 2002 | -1.500 | 650.000% | -19.763% | N/A |
| 2003 | -1.600 | 6.667% | -8.603% | N/A |
| 2004 | -1.400 | -12.500% | -7.713% | N/A |
| 2005 | -1.202 | -14.143% | -6.621% | N/A |
| 2006 | -0.887 | -26.206% | -4.655% | N/A |
| 2007 | 0.238 | -126.832% | 1.208% | N/A |
| 2008 | 0.596 | 150.420% | 2.860% | N/A |
| 2009 | 0.270 | -54.698% | 1.357% | N/A |
| 2010 | 0.362 | 34.074% | 1.913% | N/A |
| 2011 | 0.677 | 87.017% | 3.505% | N/A |
| 2012 | 0.539 | -20.384% | 2.791% | N/A |
| 2013 | 0.369 | -31.540% | 2.137% | N/A |
| 2014 | 0.365 | -1.084% | 3.019% | N/A |
Historical Energy Data about Azerbaijan
Total Oil Supply
Total Consumption of Petroleum Products
Oil and Petroleum Products, Net Exports/Imports (-)
Production of Crude Oil including Lease Condensate
Crude Oil Proved Reserves
Dry Natural Gas Production
Dry Natural Gas Consumption
Dry Natural Gas, Net Exports/Imports (-)
Proved Reserves of Natural Gas
Total Coal Consumption
Coal, Net Exports/Imports (-)
Total Electricity Net Generation
Total Electricity Net Consumption
Total Electricity Exports
Total Electricity Imports
Electricity, Net Exports/Imports (-)
Total Conventional Thermal Electricity Net Generation
Hydroelectricity Net Generation
Total Primary Energy Production
Total Primary Energy Consumption
Total Carbon Dioxide Emissions from the Consumption of Energy
Population