| Business / Energy Data |
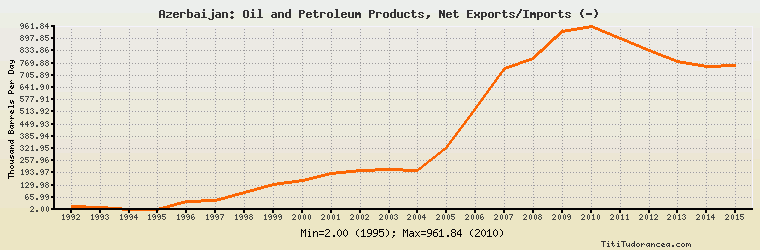
Azerbaijan: Oil and Petroleum Products, Net Exports/Imports (-)
Thousand Barrels Per Day
| Year | Azerbaijan | Change, percent | Azerbaijan, percent of Eurasia | Azerbaijan, percent of World |
| 1992 | 19.000 | N/A | 0.971% | N/A |
| 1993 | 12.000 | -36.842% | 0.542% | N/A |
| 1994 | 4.000 | -66.667% | 0.167% | N/A |
| 1995 | 2.000 | -50.000% | 0.079% | N/A |
| 1996 | 46.000 | 2,200.000% | 1.527% | N/A |
| 1997 | 51.000 | 10.870% | 1.536% | N/A |
| 1998 | 91.000 | 78.431% | 2.630% | N/A |
| 1999 | 135.000 | 48.352% | 3.438% | N/A |
| 2000 | 151.587 | 12.287% | 3.395% | N/A |
| 2001 | 188.862 | 24.590% | 3.782% | N/A |
| 2002 | 205.418 | 8.766% | 3.667% | N/A |
| 2003 | 214.175 | 4.263% | 3.288% | N/A |
| 2004 | 204.634 | -4.455% | 2.799% | N/A |
| 2005 | 325.006 | 58.823% | 4.263% | N/A |
| 2006 | 532.580 | 63.868% | 6.635% | N/A |
| 2007 | 740.069 | 38.959% | 8.614% | N/A |
| 2008 | 794.193 | 7.313% | 9.365% | N/A |
| 2009 | 935.945 | 17.849% | 10.527% | N/A |
| 2010 | 961.844 | 2.767% | 10.643% | N/A |
| 2011 | 901.261 | -6.299% | 10.213% | N/A |
| 2012 | 834.756 | -7.379% | 9.312% | N/A |
| 2013 | 780.475 | -6.503% | 8.559% | N/A |
| 2014 | 752.571 | -3.575% | 8.373% | N/A |
| 2015 | 757.221 | 0.618% | 8.080% | N/A |
Historical Energy Data about Azerbaijan
Total Oil Supply
Total Consumption of Petroleum Products
Oil and Petroleum Products, Net Exports/Imports (-)
Production of Crude Oil including Lease Condensate
Crude Oil Proved Reserves
Dry Natural Gas Production
Dry Natural Gas Consumption
Dry Natural Gas, Net Exports/Imports (-)
Proved Reserves of Natural Gas
Total Coal Consumption
Coal, Net Exports/Imports (-)
Total Electricity Net Generation
Total Electricity Net Consumption
Total Electricity Exports
Total Electricity Imports
Electricity, Net Exports/Imports (-)
Total Conventional Thermal Electricity Net Generation
Hydroelectricity Net Generation
Total Primary Energy Production
Total Primary Energy Consumption
Total Carbon Dioxide Emissions from the Consumption of Energy
Population