| Business / Energy Data |
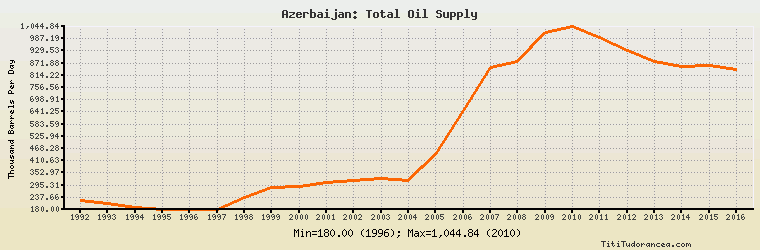
Azerbaijan: Total Oil Supply
Thousand Barrels Per Day
| Year | Azerbaijan | Change, percent | Azerbaijan, percent of Eurasia | Azerbaijan, percent of World |
| 1980 | N/A | N/A | N/A | N/A |
| 1981 | N/A | N/A | N/A | N/A |
| 1982 | N/A | N/A | N/A | N/A |
| 1983 | N/A | N/A | N/A | N/A |
| 1984 | N/A | N/A | N/A | N/A |
| 1985 | N/A | N/A | N/A | N/A |
| 1986 | N/A | N/A | N/A | N/A |
| 1987 | N/A | N/A | N/A | N/A |
| 1988 | N/A | N/A | N/A | N/A |
| 1989 | N/A | N/A | N/A | N/A |
| 1990 | N/A | N/A | N/A | N/A |
| 1991 | N/A | N/A | N/A | N/A |
| 1992 | 222.000 | N/A | 2.526% | 0.334% |
| 1993 | 206.000 | -7.207% | 2.618% | 0.307% |
| 1994 | 191.000 | -7.282% | 2.634% | 0.278% |
| 1995 | 181.000 | -5.236% | 2.535% | 0.257% |
| 1996 | 180.000 | -0.552% | 2.555% | 0.250% |
| 1997 | 180.000 | 0.000% | 2.495% | 0.243% |
| 1998 | 237.000 | 31.667% | 3.263% | 0.313% |
| 1999 | 284.000 | 19.831% | 3.718% | 0.379% |
| 2000 | 288.587 | 1.615% | 3.526% | 0.371% |
| 2001 | 308.862 | 7.026% | 3.520% | 0.398% |
| 2002 | 315.418 | 2.123% | 3.345% | 0.409% |
| 2003 | 325.175 | 3.093% | 3.119% | 0.408% |
| 2004 | 317.634 | -2.319% | 2.799% | 0.381% |
| 2005 | 440.006 | 38.526% | 3.740% | 0.517% |
| 2006 | 646.580 | 46.948% | 5.294% | 0.759% |
| 2007 | 849.069 | 31.317% | 6.692% | 0.996% |
| 2008 | 878.193 | 3.430% | 6.948% | 1.014% |
| 2009 | 1,015.945 | 15.686% | 7.800% | 1.183% |
| 2010 | 1,044.844 | 2.845% | 7.817% | 1.184% |
| 2011 | 993.261 | -4.937% | 7.361% | 1.119% |
| 2012 | 931.756 | -6.192% | 6.847% | 1.026% |
| 2013 | 880.475 | -5.504% | 6.389% | 0.965% |
| 2014 | 856.571 | -2.715% | 6.162% | 0.913% |
| 2015 | 858.221 | 0.193% | 6.082% | 0.887% |
| 2016 | 843.590 | -1.705% | 5.928% | 0.868% |
Historical Energy Data about Azerbaijan
Total Oil Supply
Total Consumption of Petroleum Products
Oil and Petroleum Products, Net Exports/Imports (-)
Production of Crude Oil including Lease Condensate
Crude Oil Proved Reserves
Dry Natural Gas Production
Dry Natural Gas Consumption
Dry Natural Gas, Net Exports/Imports (-)
Proved Reserves of Natural Gas
Total Coal Consumption
Coal, Net Exports/Imports (-)
Total Electricity Net Generation
Total Electricity Net Consumption
Total Electricity Exports
Total Electricity Imports
Electricity, Net Exports/Imports (-)
Total Conventional Thermal Electricity Net Generation
Hydroelectricity Net Generation
Total Primary Energy Production
Total Primary Energy Consumption
Total Carbon Dioxide Emissions from the Consumption of Energy
Population