| Business / Energy Data |
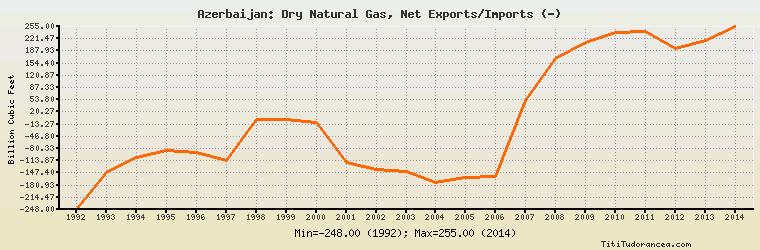
Azerbaijan: Dry Natural Gas, Net Exports/Imports (-)
Billion Cubic Feet
| Year | Azerbaijan | Change, percent | Azerbaijan, percent of Eurasia | Azerbaijan, percent of World |
| 1992 | -248.000 | N/A | -6.812% | N/A |
| 1993 | -145.000 | -41.532% | -4.117% | N/A |
| 1994 | -106.000 | -26.897% | -2.854% | N/A |
| 1995 | -85.000 | -19.811% | -2.015% | N/A |
| 1996 | -91.000 | 7.059% | -2.037% | N/A |
| 1997 | -113.000 | 24.176% | -2.760% | N/A |
| 1998 | 0.000 | -100.000% | 0.00% | N/A |
| 1999 | 0.000 | 0.000% | 0.00% | N/A |
| 2000 | -10.000 | 0.000% | -0.215% | N/A |
| 2001 | -118.000 | 1,080.000% | -2.376% | N/A |
| 2002 | -138.000 | 16.949% | -2.986% | N/A |
| 2003 | -144.000 | 4.348% | -3.155% | N/A |
| 2004 | -174.000 | 20.833% | -3.868% | N/A |
| 2005 | -161.000 | -7.471% | -3.217% | N/A |
| 2006 | -158.000 | -1.863% | -3.032% | N/A |
| 2007 | 52.000 | -132.911% | 1.004% | N/A |
| 2008 | 167.000 | 221.154% | 3.250% | N/A |
| 2009 | 210.000 | 25.749% | 4.210% | N/A |
| 2010 | 239.000 | 13.810% | 5.068% | N/A |
| 2011 | 241.000 | 0.837% | 3.764% | N/A |
| 2012 | 195.000 | -19.087% | 3.443% | N/A |
| 2013 | 217.000 | 11.282% | 3.247% | N/A |
| 2014 | 255.000 | 17.512% | 3.803% | N/A |
Historical Energy Data about Azerbaijan
Total Oil Supply
Total Consumption of Petroleum Products
Oil and Petroleum Products, Net Exports/Imports (-)
Production of Crude Oil including Lease Condensate
Crude Oil Proved Reserves
Dry Natural Gas Production
Dry Natural Gas Consumption
Dry Natural Gas, Net Exports/Imports (-)
Proved Reserves of Natural Gas
Total Coal Consumption
Coal, Net Exports/Imports (-)
Total Electricity Net Generation
Total Electricity Net Consumption
Total Electricity Exports
Total Electricity Imports
Electricity, Net Exports/Imports (-)
Total Conventional Thermal Electricity Net Generation
Hydroelectricity Net Generation
Total Primary Energy Production
Total Primary Energy Consumption
Total Carbon Dioxide Emissions from the Consumption of Energy
Population