| Business / Energy Data |
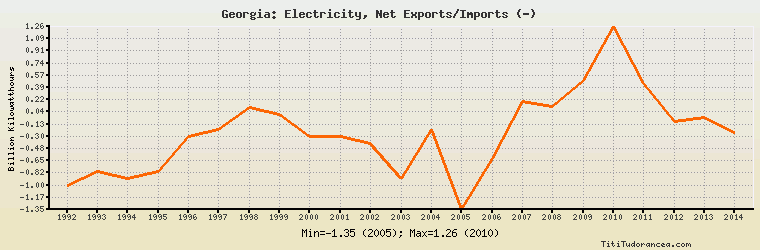
Georgia: Electricity, Net Exports/Imports (-)
Billion Kilowatthours
| Year | Georgia | Change, percent | Georgia, percent of Eurasia | Georgia, percent of World |
| 1992 | -1.000 | N/A | -8.961% | N/A |
| 1993 | -0.800 | -20.000% | -10.057% | N/A |
| 1994 | -0.900 | 12.500% | -6.752% | N/A |
| 1995 | -0.800 | -11.111% | -8.487% | N/A |
| 1996 | -0.300 | -62.500% | -2.786% | N/A |
| 1997 | -0.200 | -33.333% | -2.293% | N/A |
| 1998 | 0.100 | -150.000% | 0.962% | N/A |
| 1999 | 0.000 | -100.000% | 0.00% | N/A |
| 2000 | -0.300 | 0.000% | -4.742% | N/A |
| 2001 | -0.300 | 0.000% | -1.885% | N/A |
| 2002 | -0.400 | 33.333% | -5.270% | N/A |
| 2003 | -0.900 | 125.000% | -4.839% | N/A |
| 2004 | -0.202 | -77.556% | -1.113% | N/A |
| 2005 | -1.346 | 566.337% | -7.415% | N/A |
| 2006 | -0.616 | -54.235% | -3.233% | N/A |
| 2007 | 0.198 | -132.143% | 1.005% | N/A |
| 2008 | 0.117 | -40.909% | 0.562% | N/A |
| 2009 | 0.485 | 314.530% | 2.438% | N/A |
| 2010 | 1.260 | 159.794% | 6.660% | N/A |
| 2011 | 0.453 | -64.048% | 2.345% | N/A |
| 2012 | -0.087 | -119.205% | -0.451% | N/A |
| 2013 | -0.034 | -60.920% | -0.197% | N/A |
| 2014 | -0.249 | 632.353% | -2.060% | N/A |
Historical Energy Data about Georgia
Total Oil Supply
Total Consumption of Petroleum Products
Oil and Petroleum Products, Net Exports/Imports (-)
Production of Crude Oil including Lease Condensate
Crude Oil Proved Reserves
Dry Natural Gas Production
Dry Natural Gas Consumption
Dry Natural Gas, Net Exports/Imports (-)
Proved Reserves of Natural Gas
Total Primary Coal Production
Total Coal Consumption
Coal, Net Exports/Imports (-)
Total Electricity Net Generation
Total Electricity Net Consumption
Total Electricity Exports
Total Electricity Imports
Electricity, Net Exports/Imports (-)
Total Conventional Thermal Electricity Net Generation
Hydroelectricity Net Generation
Total Primary Energy Production
Total Primary Energy Consumption
Total Carbon Dioxide Emissions from the Consumption of Energy
Population