| Business / Energy Data |
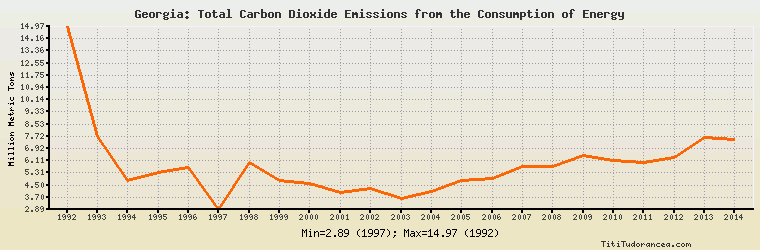
Georgia: Total Carbon Dioxide Emissions from the Consumption of Energy
Million Metric Tons
| Year | Georgia | Change, percent | Georgia, percent of Eurasia | Georgia, percent of World |
| 1980 | N/A | N/A | N/A | N/A |
| 1981 | N/A | N/A | N/A | N/A |
| 1982 | N/A | N/A | N/A | N/A |
| 1983 | N/A | N/A | N/A | N/A |
| 1984 | N/A | N/A | N/A | N/A |
| 1985 | N/A | N/A | N/A | N/A |
| 1986 | N/A | N/A | N/A | N/A |
| 1987 | N/A | N/A | N/A | N/A |
| 1988 | N/A | N/A | N/A | N/A |
| 1989 | N/A | N/A | N/A | N/A |
| 1990 | N/A | N/A | N/A | N/A |
| 1991 | N/A | N/A | N/A | N/A |
| 1992 | 14.969 | N/A | 0.452% | 0.071% |
| 1993 | 7.722 | -48.413% | 0.257% | 0.036% |
| 1994 | 4.830 | -37.451% | 0.180% | 0.023% |
| 1995 | 5.338 | 10.518% | 0.208% | 0.024% |
| 1996 | 5.655 | 5.939% | 0.240% | 0.025% |
| 1997 | 2.890 | -48.895% | 0.131% | 0.013% |
| 1998 | 5.961 | 106.263% | 0.273% | 0.026% |
| 1999 | 4.781 | -19.795% | 0.219% | 0.021% |
| 2000 | 4.588 | -4.037% | 0.204% | 0.019% |
| 2001 | 3.981 | -13.230% | 0.179% | 0.017% |
| 2002 | 4.253 | 6.832% | 0.188% | 0.017% |
| 2003 | 3.616 | -14.978% | 0.153% | 0.014% |
| 2004 | 4.088 | 13.053% | 0.168% | 0.015% |
| 2005 | 4.818 | 17.857% | 0.198% | 0.017% |
| 2006 | 4.912 | 1.951% | 0.198% | 0.017% |
| 2007 | 5.696 | 15.961% | 0.233% | 0.019% |
| 2008 | 5.696 | 0.000% | 0.225% | 0.019% |
| 2009 | 6.443 | 13.114% | 0.288% | 0.022% |
| 2010 | 6.136 | -4.765% | 0.252% | 0.020% |
| 2011 | 5.971 | -2.689% | 0.234% | 0.018% |
| 2012 | 6.302 | 5.543% | 0.240% | 0.019% |
| 2013 | 7.632 | 21.104% | 0.299% | 0.023% |
| 2014 | 7.498 | -1.756% | 0.294% | 0.022% |
Historical Energy Data about Georgia
Total Oil Supply
Total Consumption of Petroleum Products
Oil and Petroleum Products, Net Exports/Imports (-)
Production of Crude Oil including Lease Condensate
Crude Oil Proved Reserves
Dry Natural Gas Production
Dry Natural Gas Consumption
Dry Natural Gas, Net Exports/Imports (-)
Proved Reserves of Natural Gas
Total Primary Coal Production
Total Coal Consumption
Coal, Net Exports/Imports (-)
Total Electricity Net Generation
Total Electricity Net Consumption
Total Electricity Exports
Total Electricity Imports
Electricity, Net Exports/Imports (-)
Total Conventional Thermal Electricity Net Generation
Hydroelectricity Net Generation
Total Primary Energy Production
Total Primary Energy Consumption
Total Carbon Dioxide Emissions from the Consumption of Energy
Population