| Business / Energy Data |
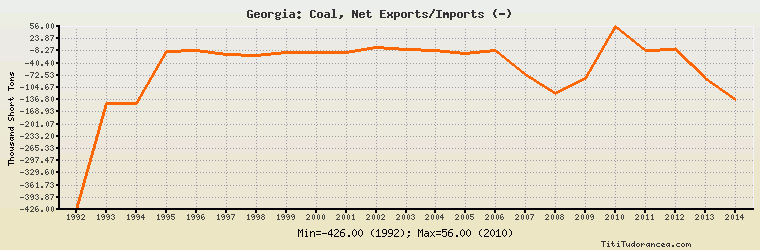
Georgia: Coal, Net Exports/Imports (-)
Thousand Short Tons
| Year | Georgia | Change, percent | Georgia, percent of Eurasia | Georgia, percent of World |
| 1992 | -426.000 | N/A | -1.439% | N/A |
| 1993 | -146.000 | -65.728% | -0.441% | N/A |
| 1994 | -146.000 | 0.000% | -0.575% | N/A |
| 1995 | -9.000 | -93.836% | -0.455% | N/A |
| 1996 | -6.000 | -33.333% | -0.283% | N/A |
| 1997 | -18.500 | 208.333% | -0.068% | N/A |
| 1998 | -20.000 | 8.108% | -0.076% | N/A |
| 1999 | -13.000 | -35.000% | -0.041% | N/A |
| 2000 | -13.300 | 2.308% | -0.033% | N/A |
| 2001 | -11.900 | -10.526% | -0.022% | N/A |
| 2002 | 0.000 | -100.000% | 0.00% | N/A |
| 2003 | -4.200 | 0.000% | -0.007% | N/A |
| 2004 | -6.200 | 47.619% | -0.010% | N/A |
| 2005 | -14.500 | 133.871% | -0.015% | N/A |
| 2006 | -8.100 | -44.138% | -0.009% | N/A |
| 2007 | -70.000 | 764.198% | -0.067% | N/A |
| 2008 | -120.000 | 71.429% | -0.116% | N/A |
| 2009 | -81.000 | -32.500% | -0.078% | N/A |
| 2010 | 56.000 | -169.136% | 0.048% | N/A |
| 2011 | -8.000 | -114.286% | -0.008% | N/A |
| 2012 | -4.000 | -50.000% | -0.003% | N/A |
| 2013 | -82.000 | 1,950.000% | -0.052% | N/A |
| 2014 | -137.000 | 67.073% | -0.082% | N/A |
Historical Energy Data about Georgia
Total Oil Supply
Total Consumption of Petroleum Products
Oil and Petroleum Products, Net Exports/Imports (-)
Production of Crude Oil including Lease Condensate
Crude Oil Proved Reserves
Dry Natural Gas Production
Dry Natural Gas Consumption
Dry Natural Gas, Net Exports/Imports (-)
Proved Reserves of Natural Gas
Total Primary Coal Production
Total Coal Consumption
Coal, Net Exports/Imports (-)
Total Electricity Net Generation
Total Electricity Net Consumption
Total Electricity Exports
Total Electricity Imports
Electricity, Net Exports/Imports (-)
Total Conventional Thermal Electricity Net Generation
Hydroelectricity Net Generation
Total Primary Energy Production
Total Primary Energy Consumption
Total Carbon Dioxide Emissions from the Consumption of Energy
Population