| Business / Energy Data |
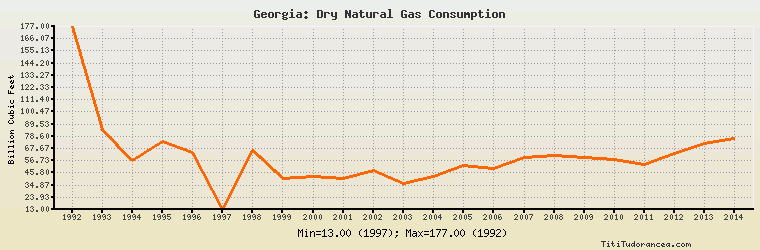
Georgia: Dry Natural Gas Consumption
Billion Cubic Feet
| Year | Georgia | Change, percent | Georgia, percent of Eurasia | Georgia, percent of World |
| 1980 | N/A | N/A | N/A | N/A |
| 1981 | N/A | N/A | N/A | N/A |
| 1982 | N/A | N/A | N/A | N/A |
| 1983 | N/A | N/A | N/A | N/A |
| 1984 | N/A | N/A | N/A | N/A |
| 1985 | N/A | N/A | N/A | N/A |
| 1986 | N/A | N/A | N/A | N/A |
| 1987 | N/A | N/A | N/A | N/A |
| 1988 | N/A | N/A | N/A | N/A |
| 1989 | N/A | N/A | N/A | N/A |
| 1990 | N/A | N/A | N/A | N/A |
| 1991 | N/A | N/A | N/A | N/A |
| 1992 | 177.000 | N/A | 0.743% | 0.235% |
| 1993 | 85.000 | -51.977% | 0.364% | 0.111% |
| 1994 | 57.000 | -32.941% | 0.263% | 0.074% |
| 1995 | 74.000 | 29.825% | 0.358% | 0.094% |
| 1996 | 64.000 | -13.514% | 0.329% | 0.079% |
| 1997 | 13.000 | -79.688% | 0.070% | 0.016% |
| 1998 | 66.000 | 407.692% | 0.356% | 0.081% |
| 1999 | 41.000 | -37.879% | 0.219% | 0.049% |
| 2000 | 43.000 | 4.878% | 0.221% | 0.049% |
| 2001 | 41.000 | -4.651% | 0.211% | 0.047% |
| 2002 | 48.000 | 17.073% | 0.237% | 0.053% |
| 2003 | 36.000 | -25.000% | 0.170% | 0.038% |
| 2004 | 43.000 | 19.444% | 0.197% | 0.044% |
| 2005 | 52.000 | 20.930% | 0.239% | 0.052% |
| 2006 | 50.000 | -3.846% | 0.225% | 0.049% |
| 2007 | 60.000 | 20.000% | 0.266% | 0.057% |
| 2008 | 61.000 | 1.667% | 0.266% | 0.056% |
| 2009 | 60.000 | -1.639% | 0.314% | 0.057% |
| 2010 | 58.000 | -3.333% | 0.270% | 0.051% |
| 2011 | 53.000 | -8.621% | 0.240% | 0.045% |
| 2012 | 63.000 | 18.868% | 0.279% | 0.052% |
| 2013 | 72.000 | 14.286% | 0.325% | 0.059% |
| 2014 | 77.000 | 6.944% | 0.359% | 0.063% |
Historical Energy Data about Georgia
Total Oil Supply
Total Consumption of Petroleum Products
Oil and Petroleum Products, Net Exports/Imports (-)
Production of Crude Oil including Lease Condensate
Crude Oil Proved Reserves
Dry Natural Gas Production
Dry Natural Gas Consumption
Dry Natural Gas, Net Exports/Imports (-)
Proved Reserves of Natural Gas
Total Primary Coal Production
Total Coal Consumption
Coal, Net Exports/Imports (-)
Total Electricity Net Generation
Total Electricity Net Consumption
Total Electricity Exports
Total Electricity Imports
Electricity, Net Exports/Imports (-)
Total Conventional Thermal Electricity Net Generation
Hydroelectricity Net Generation
Total Primary Energy Production
Total Primary Energy Consumption
Total Carbon Dioxide Emissions from the Consumption of Energy
Population