| Business / Energy Data |
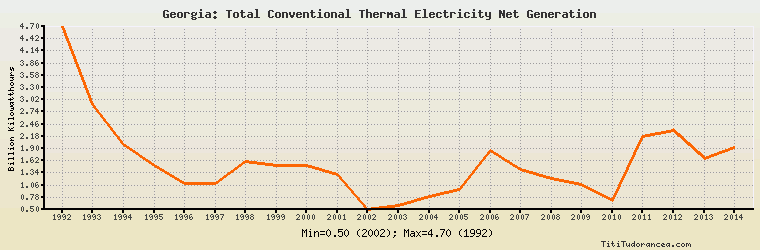
Georgia: Total Conventional Thermal Electricity Net Generation
Billion Kilowatthours
| Year | Georgia | Change, percent | Georgia, percent of Eurasia | Georgia, percent of World |
| 1980 | N/A | N/A | N/A | N/A |
| 1981 | N/A | N/A | N/A | N/A |
| 1982 | N/A | N/A | N/A | N/A |
| 1983 | N/A | N/A | N/A | N/A |
| 1984 | N/A | N/A | N/A | N/A |
| 1985 | N/A | N/A | N/A | N/A |
| 1986 | N/A | N/A | N/A | N/A |
| 1987 | N/A | N/A | N/A | N/A |
| 1988 | N/A | N/A | N/A | N/A |
| 1989 | N/A | N/A | N/A | N/A |
| 1990 | N/A | N/A | N/A | N/A |
| 1991 | N/A | N/A | N/A | N/A |
| 1992 | 4.700 | N/A | 0.444% | 0.065% |
| 1993 | 2.900 | -38.298% | 0.304% | 0.039% |
| 1994 | 2.000 | -31.034% | 0.242% | 0.026% |
| 1995 | 1.500 | -25.000% | 0.184% | 0.019% |
| 1996 | 1.100 | -26.667% | 0.139% | 0.014% |
| 1997 | 1.100 | 0.000% | 0.143% | 0.013% |
| 1998 | 1.600 | 45.455% | 0.212% | 0.019% |
| 1999 | 1.500 | -6.250% | 0.199% | 0.017% |
| 2000 | 1.500 | 0.000% | 0.194% | 0.016% |
| 2001 | 1.300 | -13.333% | 0.167% | 0.014% |
| 2002 | 0.500 | -61.538% | 0.064% | 0.005% |
| 2003 | 0.600 | 20.000% | 0.073% | 0.006% |
| 2004 | 0.800 | 33.333% | 0.097% | 0.007% |
| 2005 | 0.969 | 21.125% | 0.115% | 0.008% |
| 2006 | 1.854 | 91.331% | 0.208% | 0.015% |
| 2007 | 1.423 | -23.247% | 0.156% | 0.011% |
| 2008 | 1.214 | -14.687% | 0.129% | 0.009% |
| 2009 | 1.077 | -11.285% | 0.124% | 0.008% |
| 2010 | 0.712 | -33.890% | 0.076% | 0.005% |
| 2011 | 2.166 | 204.213% | 0.226% | 0.015% |
| 2012 | 2.324 | 7.295% | 0.237% | 0.016% |
| 2013 | 1.681 | -27.668% | 0.173% | 0.011% |
| 2014 | 1.914 | 13.861% | 0.198% | 0.013% |
Historical Energy Data about Georgia
Total Oil Supply
Total Consumption of Petroleum Products
Oil and Petroleum Products, Net Exports/Imports (-)
Production of Crude Oil including Lease Condensate
Crude Oil Proved Reserves
Dry Natural Gas Production
Dry Natural Gas Consumption
Dry Natural Gas, Net Exports/Imports (-)
Proved Reserves of Natural Gas
Total Primary Coal Production
Total Coal Consumption
Coal, Net Exports/Imports (-)
Total Electricity Net Generation
Total Electricity Net Consumption
Total Electricity Exports
Total Electricity Imports
Electricity, Net Exports/Imports (-)
Total Conventional Thermal Electricity Net Generation
Hydroelectricity Net Generation
Total Primary Energy Production
Total Primary Energy Consumption
Total Carbon Dioxide Emissions from the Consumption of Energy
Population