| Business / Energy Data |
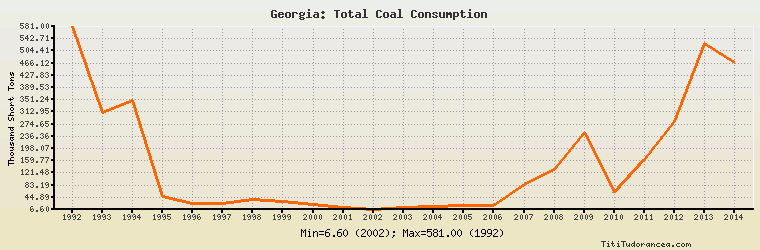
Georgia: Total Coal Consumption
Thousand Short Tons
| Year | Georgia | Change, percent | Georgia, percent of Eurasia | Georgia, percent of World |
| 1980 | N/A | N/A | N/A | N/A |
| 1981 | N/A | N/A | N/A | N/A |
| 1982 | N/A | N/A | N/A | N/A |
| 1983 | N/A | N/A | N/A | N/A |
| 1984 | N/A | N/A | N/A | N/A |
| 1985 | N/A | N/A | N/A | N/A |
| 1986 | N/A | N/A | N/A | N/A |
| 1987 | N/A | N/A | N/A | N/A |
| 1988 | N/A | N/A | N/A | N/A |
| 1989 | N/A | N/A | N/A | N/A |
| 1990 | N/A | N/A | N/A | N/A |
| 1991 | N/A | N/A | N/A | N/A |
| 1992 | 581.000 | N/A | 0.096% | 0.012% |
| 1993 | 311.000 | -46.472% | 0.059% | 0.006% |
| 1994 | 349.000 | 12.219% | 0.074% | 0.007% |
| 1995 | 46.000 | -86.819% | 0.010% | 0.001% |
| 1996 | 24.000 | -47.826% | 0.006% | 0.000% |
| 1997 | 24.000 | 0.000% | 0.006% | 0.000% |
| 1998 | 37.000 | 54.167% | 0.010% | 0.001% |
| 1999 | 31.000 | -16.216% | 0.008% | 0.001% |
| 2000 | 21.000 | -32.258% | 0.006% | 0.000% |
| 2001 | 13.000 | -38.095% | 0.003% | 0.000% |
| 2002 | 6.600 | -49.231% | 0.002% | 0.000% |
| 2003 | 13.000 | 96.970% | 0.003% | 0.000% |
| 2004 | 15.000 | 15.385% | 0.004% | 0.000% |
| 2005 | 20.000 | 33.333% | 0.005% | 0.000% |
| 2006 | 18.000 | -10.000% | 0.005% | 0.000% |
| 2007 | 85.000 | 372.222% | 0.021% | 0.001% |
| 2008 | 132.000 | 55.294% | 0.031% | 0.002% |
| 2009 | 249.000 | 88.636% | 0.065% | 0.003% |
| 2010 | 60.000 | -75.904% | 0.015% | 0.001% |
| 2011 | 162.000 | 170.000% | 0.038% | 0.002% |
| 2012 | 284.000 | 75.309% | 0.064% | 0.003% |
| 2013 | 528.000 | 85.915% | 0.128% | 0.006% |
| 2014 | 467.000 | -11.553% | 0.113% | 0.005% |
Historical Energy Data about Georgia
Total Oil Supply
Total Consumption of Petroleum Products
Oil and Petroleum Products, Net Exports/Imports (-)
Production of Crude Oil including Lease Condensate
Crude Oil Proved Reserves
Dry Natural Gas Production
Dry Natural Gas Consumption
Dry Natural Gas, Net Exports/Imports (-)
Proved Reserves of Natural Gas
Total Primary Coal Production
Total Coal Consumption
Coal, Net Exports/Imports (-)
Total Electricity Net Generation
Total Electricity Net Consumption
Total Electricity Exports
Total Electricity Imports
Electricity, Net Exports/Imports (-)
Total Conventional Thermal Electricity Net Generation
Hydroelectricity Net Generation
Total Primary Energy Production
Total Primary Energy Consumption
Total Carbon Dioxide Emissions from the Consumption of Energy
Population