| Business / Energy Data |
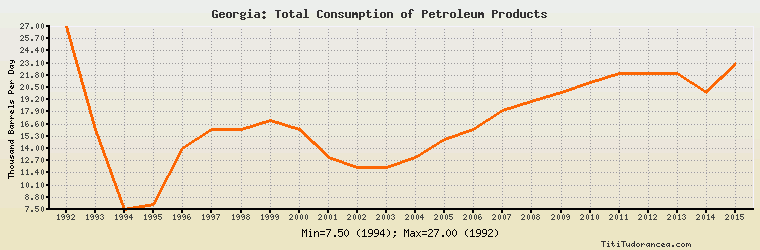
Georgia: Total Consumption of Petroleum Products
Thousand Barrels Per Day
| Year | Georgia | Change, percent | Georgia, percent of Eurasia | Georgia, percent of World |
| 1980 | N/A | N/A | N/A | N/A |
| 1981 | N/A | N/A | N/A | N/A |
| 1982 | N/A | N/A | N/A | N/A |
| 1983 | N/A | N/A | N/A | N/A |
| 1984 | N/A | N/A | N/A | N/A |
| 1985 | N/A | N/A | N/A | N/A |
| 1986 | N/A | N/A | N/A | N/A |
| 1987 | N/A | N/A | N/A | N/A |
| 1988 | N/A | N/A | N/A | N/A |
| 1989 | N/A | N/A | N/A | N/A |
| 1990 | N/A | N/A | N/A | N/A |
| 1991 | N/A | N/A | N/A | N/A |
| 1992 | 27.000 | N/A | 0.395% | 0.040% |
| 1993 | 16.000 | -40.741% | 0.283% | 0.024% |
| 1994 | 7.500 | -53.125% | 0.155% | 0.011% |
| 1995 | 8.000 | 6.667% | 0.174% | 0.011% |
| 1996 | 14.000 | 75.000% | 0.347% | 0.020% |
| 1997 | 16.000 | 14.286% | 0.411% | 0.022% |
| 1998 | 16.000 | 0.000% | 0.421% | 0.022% |
| 1999 | 17.000 | 6.250% | 0.458% | 0.022% |
| 2000 | 16.000 | -5.882% | 0.430% | 0.021% |
| 2001 | 13.000 | -18.750% | 0.344% | 0.017% |
| 2002 | 12.000 | -7.692% | 0.314% | 0.015% |
| 2003 | 12.000 | 0.000% | 0.307% | 0.015% |
| 2004 | 13.000 | 8.333% | 0.322% | 0.016% |
| 2005 | 15.000 | 15.385% | 0.362% | 0.018% |
| 2006 | 16.000 | 6.667% | 0.382% | 0.019% |
| 2007 | 18.000 | 12.500% | 0.439% | 0.021% |
| 2008 | 19.000 | 5.556% | 0.457% | 0.022% |
| 2009 | 20.000 | 5.263% | 0.484% | 0.023% |
| 2010 | 21.000 | 5.000% | 0.485% | 0.024% |
| 2011 | 22.000 | 4.762% | 0.471% | 0.024% |
| 2012 | 22.000 | 0.000% | 0.474% | 0.024% |
| 2013 | 22.000 | 0.000% | 0.472% | 0.024% |
| 2014 | 20.000 | -9.091% | 0.407% | 0.021% |
| 2015 | 23.000 | 15.000% | 0.485% | 0.024% |
Historical Energy Data about Georgia
Total Oil Supply
Total Consumption of Petroleum Products
Oil and Petroleum Products, Net Exports/Imports (-)
Production of Crude Oil including Lease Condensate
Crude Oil Proved Reserves
Dry Natural Gas Production
Dry Natural Gas Consumption
Dry Natural Gas, Net Exports/Imports (-)
Proved Reserves of Natural Gas
Total Primary Coal Production
Total Coal Consumption
Coal, Net Exports/Imports (-)
Total Electricity Net Generation
Total Electricity Net Consumption
Total Electricity Exports
Total Electricity Imports
Electricity, Net Exports/Imports (-)
Total Conventional Thermal Electricity Net Generation
Hydroelectricity Net Generation
Total Primary Energy Production
Total Primary Energy Consumption
Total Carbon Dioxide Emissions from the Consumption of Energy
Population