| Business / Energy Data |
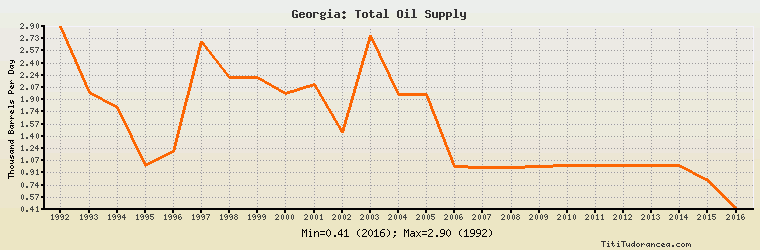
Georgia: Total Oil Supply
Thousand Barrels Per Day
| Year | Georgia | Change, percent | Georgia, percent of Eurasia | Georgia, percent of World |
| 1980 | N/A | N/A | N/A | N/A |
| 1981 | N/A | N/A | N/A | N/A |
| 1982 | N/A | N/A | N/A | N/A |
| 1983 | N/A | N/A | N/A | N/A |
| 1984 | N/A | N/A | N/A | N/A |
| 1985 | N/A | N/A | N/A | N/A |
| 1986 | N/A | N/A | N/A | N/A |
| 1987 | N/A | N/A | N/A | N/A |
| 1988 | N/A | N/A | N/A | N/A |
| 1989 | N/A | N/A | N/A | N/A |
| 1990 | N/A | N/A | N/A | N/A |
| 1991 | N/A | N/A | N/A | N/A |
| 1992 | 2.900 | N/A | 0.033% | 0.004% |
| 1993 | 2.000 | -31.034% | 0.025% | 0.003% |
| 1994 | 1.800 | -10.000% | 0.025% | 0.003% |
| 1995 | 1.000 | -44.444% | 0.014% | 0.001% |
| 1996 | 1.200 | 20.000% | 0.017% | 0.002% |
| 1997 | 2.700 | 125.000% | 0.037% | 0.004% |
| 1998 | 2.200 | -18.519% | 0.030% | 0.003% |
| 1999 | 2.200 | 0.000% | 0.029% | 0.003% |
| 2000 | 1.990 | -9.545% | 0.024% | 0.003% |
| 2001 | 2.108 | 5.930% | 0.024% | 0.003% |
| 2002 | 1.462 | -30.645% | 0.016% | 0.002% |
| 2003 | 2.781 | 90.219% | 0.027% | 0.003% |
| 2004 | 1.979 | -28.839% | 0.017% | 0.002% |
| 2005 | 1.977 | -0.101% | 0.017% | 0.002% |
| 2006 | 0.995 | -49.671% | 0.008% | 0.001% |
| 2007 | 0.984 | -1.106% | 0.008% | 0.001% |
| 2008 | 0.979 | -0.508% | 0.008% | 0.001% |
| 2009 | 0.993 | 1.430% | 0.008% | 0.001% |
| 2010 | 1.000 | 0.705% | 0.007% | 0.001% |
| 2011 | 1.000 | 0.000% | 0.007% | 0.001% |
| 2012 | 1.007 | 0.700% | 0.007% | 0.001% |
| 2013 | 1.007 | 0.000% | 0.007% | 0.001% |
| 2014 | 1.007 | 0.000% | 0.007% | 0.001% |
| 2015 | 0.806 | -19.960% | 0.006% | 0.001% |
| 2016 | 0.407 | -49.504% | 0.003% | 0.000% |
Historical Energy Data about Georgia
Total Oil Supply
Total Consumption of Petroleum Products
Oil and Petroleum Products, Net Exports/Imports (-)
Production of Crude Oil including Lease Condensate
Crude Oil Proved Reserves
Dry Natural Gas Production
Dry Natural Gas Consumption
Dry Natural Gas, Net Exports/Imports (-)
Proved Reserves of Natural Gas
Total Primary Coal Production
Total Coal Consumption
Coal, Net Exports/Imports (-)
Total Electricity Net Generation
Total Electricity Net Consumption
Total Electricity Exports
Total Electricity Imports
Electricity, Net Exports/Imports (-)
Total Conventional Thermal Electricity Net Generation
Hydroelectricity Net Generation
Total Primary Energy Production
Total Primary Energy Consumption
Total Carbon Dioxide Emissions from the Consumption of Energy
Population