| Business / Energy Data |
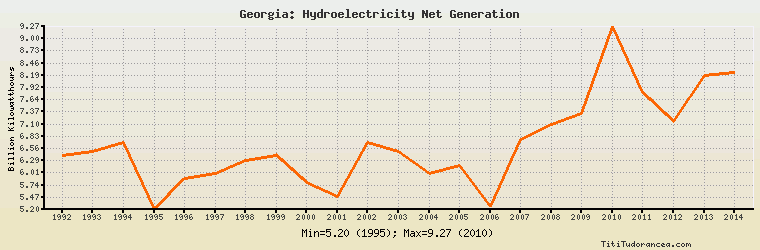
Georgia: Hydroelectricity Net Generation
Billion Kilowatthours
| Year | Georgia | Change, percent | Georgia, percent of Eurasia | Georgia, percent of World |
| 1980 | N/A | N/A | N/A | N/A |
| 1981 | N/A | N/A | N/A | N/A |
| 1982 | N/A | N/A | N/A | N/A |
| 1983 | N/A | N/A | N/A | N/A |
| 1984 | N/A | N/A | N/A | N/A |
| 1985 | N/A | N/A | N/A | N/A |
| 1986 | N/A | N/A | N/A | N/A |
| 1987 | N/A | N/A | N/A | N/A |
| 1988 | N/A | N/A | N/A | N/A |
| 1989 | N/A | N/A | N/A | N/A |
| 1990 | N/A | N/A | N/A | N/A |
| 1991 | N/A | N/A | N/A | N/A |
| 1992 | 6.400 | N/A | 2.778% | 0.292% |
| 1993 | 6.500 | 1.562% | 2.706% | 0.281% |
| 1994 | 6.700 | 3.077% | 2.729% | 0.287% |
| 1995 | 5.200 | -22.388% | 2.208% | 0.212% |
| 1996 | 5.900 | 13.462% | 2.777% | 0.237% |
| 1997 | 6.000 | 1.695% | 2.804% | 0.236% |
| 1998 | 6.300 | 5.000% | 2.843% | 0.247% |
| 1999 | 6.400 | 1.587% | 2.850% | 0.247% |
| 2000 | 5.800 | -9.375% | 2.565% | 0.221% |
| 2001 | 5.500 | -5.172% | 2.336% | 0.214% |
| 2002 | 6.700 | 21.818% | 2.987% | 0.258% |
| 2003 | 6.500 | -2.985% | 2.936% | 0.249% |
| 2004 | 6.000 | -7.692% | 2.453% | 0.216% |
| 2005 | 6.174 | 2.900% | 2.531% | 0.213% |
| 2006 | 5.262 | -14.772% | 2.165% | 0.175% |
| 2007 | 6.750 | 28.278% | 2.770% | 0.221% |
| 2008 | 7.090 | 5.037% | 3.020% | 0.223% |
| 2009 | 7.338 | 3.498% | 3.032% | 0.227% |
| 2010 | 9.273 | 26.370% | 3.810% | 0.272% |
| 2011 | 7.811 | -15.766% | 3.260% | 0.225% |
| 2012 | 7.151 | -8.450% | 2.984% | 0.197% |
| 2013 | 8.188 | 14.501% | 3.178% | 0.218% |
| 2014 | 8.252 | 0.782% | 3.367% | 0.214% |
Historical Energy Data about Georgia
Total Oil Supply
Total Consumption of Petroleum Products
Oil and Petroleum Products, Net Exports/Imports (-)
Production of Crude Oil including Lease Condensate
Crude Oil Proved Reserves
Dry Natural Gas Production
Dry Natural Gas Consumption
Dry Natural Gas, Net Exports/Imports (-)
Proved Reserves of Natural Gas
Total Primary Coal Production
Total Coal Consumption
Coal, Net Exports/Imports (-)
Total Electricity Net Generation
Total Electricity Net Consumption
Total Electricity Exports
Total Electricity Imports
Electricity, Net Exports/Imports (-)
Total Conventional Thermal Electricity Net Generation
Hydroelectricity Net Generation
Total Primary Energy Production
Total Primary Energy Consumption
Total Carbon Dioxide Emissions from the Consumption of Energy
Population