| Business / Energy Data |
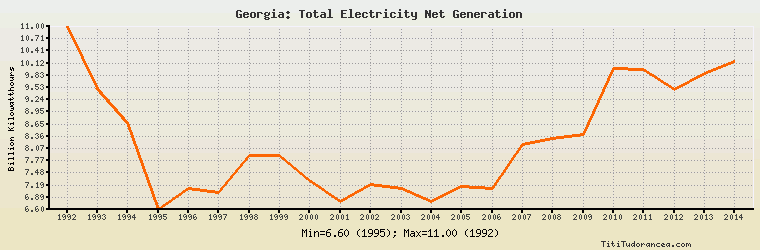
Georgia: Total Electricity Net Generation
Billion Kilowatthours
| Year | Georgia | Change, percent | Georgia, percent of Eurasia | Georgia, percent of World |
| 1980 | N/A | N/A | N/A | N/A |
| 1981 | N/A | N/A | N/A | N/A |
| 1982 | N/A | N/A | N/A | N/A |
| 1983 | N/A | N/A | N/A | N/A |
| 1984 | N/A | N/A | N/A | N/A |
| 1985 | N/A | N/A | N/A | N/A |
| 1986 | N/A | N/A | N/A | N/A |
| 1987 | N/A | N/A | N/A | N/A |
| 1988 | N/A | N/A | N/A | N/A |
| 1989 | N/A | N/A | N/A | N/A |
| 1990 | N/A | N/A | N/A | N/A |
| 1991 | N/A | N/A | N/A | N/A |
| 1992 | 11.000 | N/A | 0.739% | 0.095% |
| 1993 | 9.500 | -13.636% | 0.682% | 0.080% |
| 1994 | 8.700 | -8.421% | 0.702% | 0.071% |
| 1995 | 6.600 | -24.138% | 0.540% | 0.052% |
| 1996 | 7.100 | 7.576% | 0.593% | 0.055% |
| 1997 | 7.000 | -1.408% | 0.596% | 0.053% |
| 1998 | 7.900 | 12.857% | 0.682% | 0.058% |
| 1999 | 7.900 | 0.000% | 0.675% | 0.056% |
| 2000 | 7.300 | -7.595% | 0.605% | 0.050% |
| 2001 | 6.800 | -6.849% | 0.554% | 0.046% |
| 2002 | 7.200 | 5.882% | 0.582% | 0.047% |
| 2003 | 7.100 | -1.389% | 0.556% | 0.045% |
| 2004 | 6.800 | -4.225% | 0.520% | 0.041% |
| 2005 | 7.143 | 5.044% | 0.539% | 0.041% |
| 2006 | 7.116 | -0.378% | 0.517% | 0.039% |
| 2007 | 8.173 | 14.854% | 0.581% | 0.043% |
| 2008 | 8.304 | 1.603% | 0.581% | 0.043% |
| 2009 | 8.415 | 1.337% | 0.620% | 0.044% |
| 2010 | 9.985 | 18.657% | 0.700% | 0.049% |
| 2011 | 9.977 | -0.080% | 0.687% | 0.047% |
| 2012 | 9.475 | -5.032% | 0.640% | 0.044% |
| 2013 | 9.869 | 4.158% | 0.668% | 0.044% |
| 2014 | 10.166 | 3.009% | 0.689% | 0.045% |
Historical Energy Data about Georgia
Total Oil Supply
Total Consumption of Petroleum Products
Oil and Petroleum Products, Net Exports/Imports (-)
Production of Crude Oil including Lease Condensate
Crude Oil Proved Reserves
Dry Natural Gas Production
Dry Natural Gas Consumption
Dry Natural Gas, Net Exports/Imports (-)
Proved Reserves of Natural Gas
Total Primary Coal Production
Total Coal Consumption
Coal, Net Exports/Imports (-)
Total Electricity Net Generation
Total Electricity Net Consumption
Total Electricity Exports
Total Electricity Imports
Electricity, Net Exports/Imports (-)
Total Conventional Thermal Electricity Net Generation
Hydroelectricity Net Generation
Total Primary Energy Production
Total Primary Energy Consumption
Total Carbon Dioxide Emissions from the Consumption of Energy
Population