| Business / Energy Data |
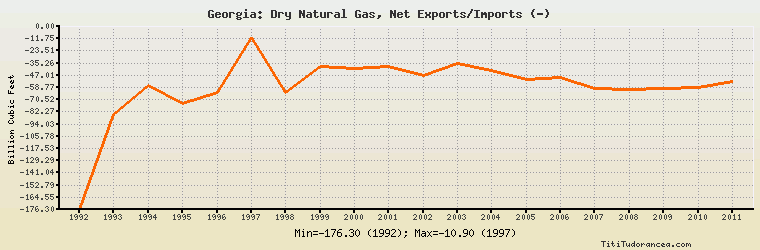
Georgia: Dry Natural Gas, Net Exports/Imports (-)
Billion Cubic Feet
| Year | Georgia | Change, percent | Georgia, percent of Eurasia | Georgia, percent of World |
| 1992 | -176.300 | N/A | -4.842% | N/A |
| 1993 | -85.000 | -51.787% | -2.413% | N/A |
| 1994 | -57.000 | -32.941% | -1.535% | N/A |
| 1995 | -74.000 | 29.825% | -1.754% | N/A |
| 1996 | -64.000 | -13.514% | -1.433% | N/A |
| 1997 | -10.900 | -82.969% | -0.266% | N/A |
| 1998 | -63.900 | 486.239% | -1.426% | N/A |
| 1999 | -38.900 | -39.124% | -0.831% | N/A |
| 2000 | -40.900 | 5.141% | -0.878% | N/A |
| 2001 | -38.900 | -4.890% | -0.783% | N/A |
| 2002 | -47.500 | 22.108% | -1.028% | N/A |
| 2003 | -35.300 | -25.684% | -0.773% | N/A |
| 2004 | -42.300 | 19.830% | -0.940% | N/A |
| 2005 | -51.500 | 21.749% | -1.029% | N/A |
| 2006 | -49.600 | -3.689% | -0.952% | N/A |
| 2007 | -59.600 | 20.161% | -1.151% | N/A |
| 2008 | -60.700 | 1.846% | -1.181% | N/A |
| 2009 | -59.600 | -1.812% | -1.195% | N/A |
| 2010 | -58.400 | -2.013% | -1.238% | N/A |
| 2011 | -52.800 | -9.589% | -0.825% | N/A |
Historical Energy Data about Georgia
Total Oil Supply
Total Consumption of Petroleum Products
Oil and Petroleum Products, Net Exports/Imports (-)
Production of Crude Oil including Lease Condensate
Crude Oil Proved Reserves
Dry Natural Gas Production
Dry Natural Gas Consumption
Dry Natural Gas, Net Exports/Imports (-)
Proved Reserves of Natural Gas
Total Primary Coal Production
Total Coal Consumption
Coal, Net Exports/Imports (-)
Total Electricity Net Generation
Total Electricity Net Consumption
Total Electricity Exports
Total Electricity Imports
Electricity, Net Exports/Imports (-)
Total Conventional Thermal Electricity Net Generation
Hydroelectricity Net Generation
Total Primary Energy Production
Total Primary Energy Consumption
Total Carbon Dioxide Emissions from the Consumption of Energy
Population