| Business / Energy Data |
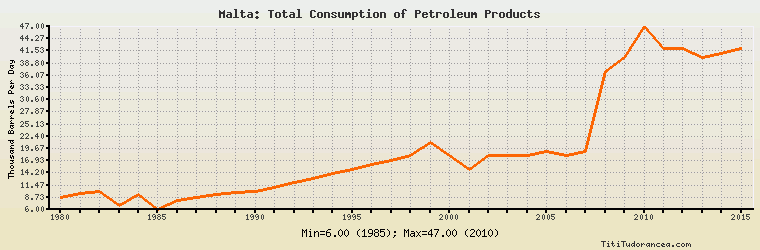
Malta: Total Consumption of Petroleum Products
Thousand Barrels Per Day
| Year | Malta | Change, percent | Malta, percent of Europe | Malta, percent of World |
| 1980 | 8.700 | N/A | 0.054% | 0.014% |
| 1981 | 9.500 | 9.195% | 0.064% | 0.016% |
| 1982 | 10.000 | 5.263% | 0.070% | 0.017% |
| 1983 | 6.800 | -32.000% | 0.049% | 0.012% |
| 1984 | 9.400 | 38.235% | 0.068% | 0.016% |
| 1985 | 6.000 | -36.170% | 0.044% | 0.010% |
| 1986 | 8.000 | 33.333% | 0.056% | 0.013% |
| 1987 | 8.700 | 8.750% | 0.061% | 0.014% |
| 1988 | 9.300 | 6.897% | 0.064% | 0.014% |
| 1989 | 9.800 | 5.376% | 0.067% | 0.015% |
| 1990 | 10.000 | 2.041% | 0.068% | 0.015% |
| 1991 | 11.000 | 10.000% | 0.074% | 0.016% |
| 1992 | 12.000 | 9.091% | 0.080% | 0.018% |
| 1993 | 13.000 | 8.333% | 0.087% | 0.019% |
| 1994 | 14.000 | 7.692% | 0.093% | 0.020% |
| 1995 | 15.000 | 7.143% | 0.098% | 0.021% |
| 1996 | 16.000 | 6.667% | 0.102% | 0.022% |
| 1997 | 17.000 | 6.250% | 0.107% | 0.023% |
| 1998 | 18.000 | 5.882% | 0.111% | 0.024% |
| 1999 | 21.000 | 16.667% | 0.131% | 0.028% |
| 2000 | 18.000 | -14.286% | 0.113% | 0.023% |
| 2001 | 15.000 | -16.667% | 0.093% | 0.019% |
| 2002 | 18.000 | 20.000% | 0.112% | 0.023% |
| 2003 | 18.000 | 0.000% | 0.111% | 0.022% |
| 2004 | 18.000 | 0.000% | 0.111% | 0.022% |
| 2005 | 19.000 | 5.556% | 0.116% | 0.022% |
| 2006 | 18.000 | -5.263% | 0.110% | 0.021% |
| 2007 | 19.000 | 5.556% | 0.117% | 0.022% |
| 2008 | 37.000 | 94.737% | 0.229% | 0.043% |
| 2009 | 40.000 | 8.108% | 0.260% | 0.047% |
| 2010 | 47.000 | 17.500% | 0.305% | 0.053% |
| 2011 | 42.000 | -10.638% | 0.282% | 0.047% |
| 2012 | 42.000 | 0.000% | 0.292% | 0.046% |
| 2013 | 40.000 | -4.762% | 0.281% | 0.043% |
| 2014 | 41.000 | 2.500% | 0.289% | 0.044% |
| 2015 | 42.000 | 2.439% | 0.292% | 0.044% |
Historical Energy Data about Malta
Total Consumption of Petroleum Products
Oil and Petroleum Products, Net Exports/Imports (-)
Dry Natural Gas, Net Exports/Imports (-)
Total Coal Consumption
Coal, Net Exports/Imports (-)
Total Electricity Net Generation
Total Electricity Net Consumption
Electricity, Net Exports/Imports (-)
Total Conventional Thermal Electricity Net Generation
Total Biofuels Production
Total Primary Energy Consumption
Total Carbon Dioxide Emissions from the Consumption of Energy
Population