| Business / Energy Data |
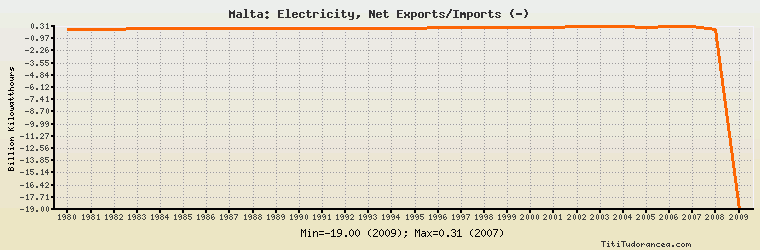
Malta: Electricity, Net Exports/Imports (-)
Billion Kilowatthours
| Year | Malta | Change, percent | Malta, percent of Europe | Malta, percent of World |
| 1980 | 0.035 | N/A | -0.185% | N/A |
| 1981 | 0.039 | 11.429% | -0.194% | N/A |
| 1982 | 0.043 | 10.256% | -0.212% | N/A |
| 1983 | 0.060 | 39.535% | -0.271% | N/A |
| 1984 | 0.065 | 8.333% | -0.278% | N/A |
| 1985 | 0.074 | 13.846% | -0.259% | N/A |
| 1986 | 0.080 | 8.108% | -0.277% | N/A |
| 1987 | 0.087 | 8.750% | -0.255% | N/A |
| 1988 | 0.095 | 9.195% | -0.251% | N/A |
| 1989 | 0.100 | 5.263% | -0.266% | N/A |
| 1990 | 0.100 | 0.000% | -0.300% | N/A |
| 1991 | 0.110 | 10.000% | -0.570% | N/A |
| 1992 | 0.120 | 9.091% | -1.075% | N/A |
| 1993 | 0.120 | 0.000% | -1.150% | N/A |
| 1994 | 0.141 | 17.500% | -1.444% | N/A |
| 1995 | 0.152 | 7.801% | -2.339% | N/A |
| 1996 | 0.218 | 43.421% | -2.988% | N/A |
| 1997 | 0.221 | 1.376% | -3.378% | N/A |
| 1998 | 0.210 | -4.977% | -2.089% | N/A |
| 1999 | 0.227 | 8.095% | -5.780% | N/A |
| 2000 | 0.235 | 3.524% | -4.196% | N/A |
| 2001 | 0.256 | 8.936% | -1.969% | N/A |
| 2002 | 0.270 | 5.469% | -1.826% | N/A |
| 2003 | 0.294 | 8.889% | -1.853% | N/A |
| 2004 | 0.291 | -1.020% | -2.459% | N/A |
| 2005 | 0.256 | -12.027% | -2.141% | N/A |
| 2006 | 0.276 | 7.813% | -2.671% | N/A |
| 2007 | 0.314 | 13.768% | -3.023% | N/A |
| 2008 | 0.000 | -100.000% | 0.00% | N/A |
| 2009 | -19.000 | 0.000% | 200.824% | N/A |
Historical Energy Data about Malta
Total Consumption of Petroleum Products
Oil and Petroleum Products, Net Exports/Imports (-)
Dry Natural Gas, Net Exports/Imports (-)
Total Coal Consumption
Coal, Net Exports/Imports (-)
Total Electricity Net Generation
Total Electricity Net Consumption
Electricity, Net Exports/Imports (-)
Total Conventional Thermal Electricity Net Generation
Total Biofuels Production
Total Primary Energy Consumption
Total Carbon Dioxide Emissions from the Consumption of Energy
Population