| Business / Energy Data |
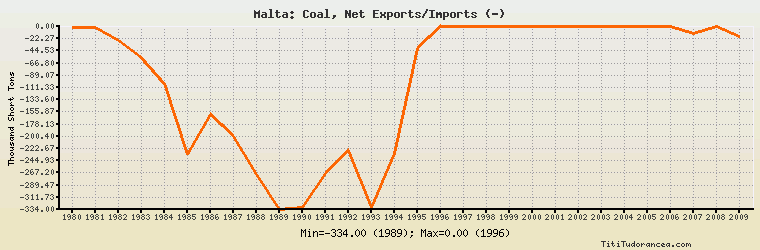
Malta: Coal, Net Exports/Imports (-)
Thousand Short Tons
| Year | Malta | Change, percent | Malta, percent of Europe | Malta, percent of World |
| 1980 | -1.000 | N/A | 0.001% | N/A |
| 1981 | -1.000 | 0.000% | 0.001% | N/A |
| 1982 | -26.000 | 2,500.000% | 0.041% | N/A |
| 1983 | -57.000 | 119.231% | 0.082% | N/A |
| 1984 | -104.000 | 82.456% | 0.087% | N/A |
| 1985 | -234.000 | 125.000% | 0.208% | N/A |
| 1986 | -161.000 | -31.197% | 0.154% | N/A |
| 1987 | -201.000 | 24.845% | 0.160% | N/A |
| 1988 | -270.000 | 34.328% | 0.232% | N/A |
| 1989 | -334.000 | 23.704% | 0.265% | N/A |
| 1990 | -331.000 | -0.898% | 0.208% | N/A |
| 1991 | -268.000 | -19.033% | 0.158% | N/A |
| 1992 | -226.000 | -15.672% | 0.148% | N/A |
| 1993 | -331.000 | 46.460% | 0.217% | N/A |
| 1994 | -231.000 | -30.211% | 0.137% | N/A |
| 1995 | -41.000 | -82.251% | 0.026% | N/A |
| 1996 | 0.000 | -100.000% | 0.00% | N/A |
| 1997 | 0.000 | 0.000% | 0.00% | N/A |
| 1998 | 0.000 | 0.000% | 0.00% | N/A |
| 1999 | 0.000 | 0.000% | 0.00% | N/A |
| 2000 | 0.000 | 0.000% | 0.00% | N/A |
| 2001 | 0.000 | 0.000% | 0.00% | N/A |
| 2002 | 0.000 | 0.000% | 0.00% | N/A |
| 2003 | 0.000 | 0.000% | 0.00% | N/A |
| 2004 | 0.000 | 0.000% | 0.00% | N/A |
| 2005 | 0.000 | 0.000% | 0.00% | N/A |
| 2006 | 0.000 | 0.000% | 0.00% | N/A |
| 2007 | -12.000 | 0.000% | 0.004% | N/A |
| 2008 | 0.000 | -100.000% | 0.00% | N/A |
| 2009 | -19.000 | 0.000% | 0.010% | N/A |
Historical Energy Data about Malta
Total Consumption of Petroleum Products
Oil and Petroleum Products, Net Exports/Imports (-)
Dry Natural Gas, Net Exports/Imports (-)
Total Coal Consumption
Coal, Net Exports/Imports (-)
Total Electricity Net Generation
Total Electricity Net Consumption
Electricity, Net Exports/Imports (-)
Total Conventional Thermal Electricity Net Generation
Total Biofuels Production
Total Primary Energy Consumption
Total Carbon Dioxide Emissions from the Consumption of Energy
Population