| Business / Energy Data |
Sierra Leone: Per Capita Carbon Dioxide Emissions from the Consumption of Energy
Metric Tons of Carbon Dioxide per Person
| Year | Sierra Leone | Change, percent | Sierra Leone, percent of Africa | Sierra Leone, percent of World |
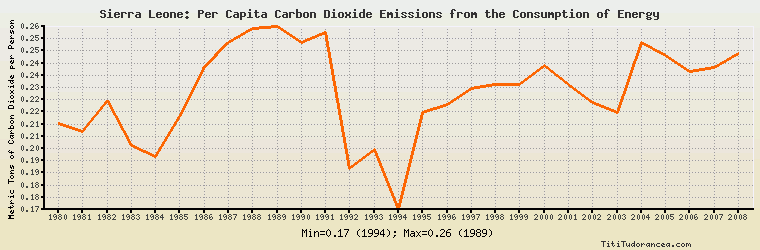
| 1980 | 0.213 | N/A | N/A | 5.129% |
| 1981 | 0.209 | -1.878% | N/A | 5.182% |
| 1982 | 0.224 | 7.177% | N/A | 5.687% |
| 1983 | 0.202 | -9.821% | N/A | 5.181% |
| 1984 | 0.197 | -2.475% | N/A | 4.902% |
| 1985 | 0.216 | 9.645% | N/A | 5.344% |
| 1986 | 0.240 | 11.111% | N/A | 5.906% |
| 1987 | 0.252 | 5.000% | N/A | 6.149% |
| 1988 | 0.259 | 2.778% | N/A | 6.223% |
| 1989 | 0.260 | 0.386% | N/A | 6.264% |
| 1990 | 0.252 | -3.077% | N/A | 6.140% |
| 1991 | 0.257 | 1.984% | N/A | 6.393% |
| 1992 | 0.191 | -25.681% | N/A | 4.846% |
| 1993 | 0.200 | 4.712% | N/A | 5.094% |
| 1994 | 0.171 | -14.500% | N/A | 4.388% |
| 1995 | 0.218 | 27.485% | N/A | 5.585% |
| 1996 | 0.222 | 1.835% | N/A | 5.640% |
| 1997 | 0.230 | 3.604% | N/A | 5.817% |
| 1998 | 0.232 | 0.870% | N/A | 5.962% |
| 1999 | 0.232 | 0.000% | N/A | 5.959% |
| 2000 | 0.241 | 3.879% | N/A | 6.142% |
| 2001 | 0.232 | -3.734% | N/A | 5.947% |
| 2002 | 0.223 | -3.879% | N/A | 5.619% |
| 2003 | 0.218 | -2.242% | N/A | 5.298% |
| 2004 | 0.252 | 15.596% | N/A | 5.827% |
| 2005 | 0.246 | -2.381% | N/A | 5.583% |
| 2006 | 0.238 | -3.252% | N/A | 5.358% |
| 2007 | 0.240 | 0.840% | N/A | 5.313% |
| 2008 | 0.247 | 2.917% | N/A | 5.441% |
| 2009 | N/A | N/A | N/A | N/A |
| 2010 | N/A | N/A | N/A | N/A |
Historical Energy Data about Sierra Leone
Total Oil Supply
Total Consumption of Petroleum Products
Oil and Petroleum Products, Net Exports/Imports (-)
Dry Natural Gas, Net Exports/Imports (-)
Coal, Net Exports/Imports (-)
Total Electricity Net Generation
Total Electricity Net Consumption
Electricity, Net Exports/Imports (-)
Total Conventional Thermal Electricity Net Generation
Total Primary Energy Consumption
Total Carbon Dioxide Emissions from the Consumption of Energy
Population