| Business / Energy Data |
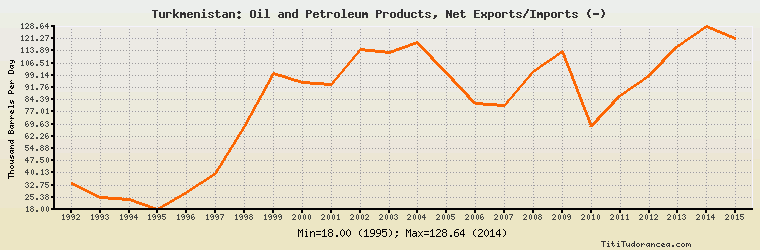
Turkmenistan: Oil and Petroleum Products, Net Exports/Imports (-)
Thousand Barrels Per Day
| Year | Turkmenistan | Change, percent | Turkmenistan, percent of Eurasia | Turkmenistan, percent of World |
| 1992 | 34.000 | N/A | 1.737% | N/A |
| 1993 | 25.000 | -26.471% | 1.129% | N/A |
| 1994 | 24.000 | -4.000% | 1.001% | N/A |
| 1995 | 18.000 | -25.000% | 0.710% | N/A |
| 1996 | 28.000 | 55.556% | 0.929% | N/A |
| 1997 | 40.000 | 42.857% | 1.205% | N/A |
| 1998 | 68.000 | 70.000% | 1.965% | N/A |
| 1999 | 100.000 | 47.059% | 2.547% | N/A |
| 2000 | 94.636 | -5.364% | 2.119% | N/A |
| 2001 | 93.875 | -0.804% | 1.880% | N/A |
| 2002 | 114.568 | 22.043% | 2.045% | N/A |
| 2003 | 113.001 | -1.368% | 1.735% | N/A |
| 2004 | 118.943 | 5.258% | 1.627% | N/A |
| 2005 | 100.650 | -15.380% | 1.320% | N/A |
| 2006 | 82.212 | -18.319% | 1.024% | N/A |
| 2007 | 80.731 | -1.801% | 0.940% | N/A |
| 2008 | 101.364 | 25.558% | 1.195% | N/A |
| 2009 | 113.644 | 12.115% | 1.278% | N/A |
| 2010 | 68.254 | -39.941% | 0.755% | N/A |
| 2011 | 87.119 | 27.639% | 0.987% | N/A |
| 2012 | 99.069 | 13.717% | 1.105% | N/A |
| 2013 | 116.415 | 17.509% | 1.277% | N/A |
| 2014 | 128.642 | 10.503% | 1.431% | N/A |
| 2015 | 121.500 | -5.552% | 1.296% | N/A |
Historical Energy Data about Turkmenistan
Total Oil Supply
Total Consumption of Petroleum Products
Oil and Petroleum Products, Net Exports/Imports (-)
Production of Crude Oil including Lease Condensate
Crude Oil Proved Reserves
Dry Natural Gas Production
Dry Natural Gas Consumption
Dry Natural Gas, Net Exports/Imports (-)
Proved Reserves of Natural Gas
Total Coal Consumption
Coal, Net Exports/Imports (-)
Total Electricity Net Generation
Total Electricity Net Consumption
Total Electricity Exports
Total Electricity Imports
Electricity, Net Exports/Imports (-)
Total Conventional Thermal Electricity Net Generation
Hydroelectricity Net Generation
Total Primary Energy Production
Total Primary Energy Consumption
Total Carbon Dioxide Emissions from the Consumption of Energy
Population