| Business / Energy Data |
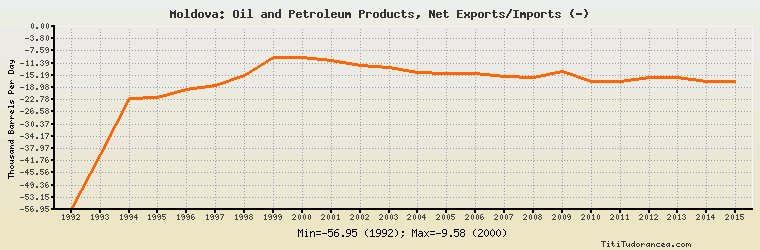
Moldova: Oil and Petroleum Products, Net Exports/Imports (-)
Thousand Barrels Per Day
| Year | Moldova | Change, percent | Moldova, percent of Eurasia | Moldova, percent of World |
| 1992 | -56.949 | N/A | -2.910% | N/A |
| 1993 | -39.929 | -29.886% | -1.804% | N/A |
| 1994 | -22.363 | -43.993% | -0.933% | N/A |
| 1995 | -22.112 | -1.122% | -0.872% | N/A |
| 1996 | -19.625 | -11.247% | -0.651% | N/A |
| 1997 | -18.424 | -6.120% | -0.555% | N/A |
| 1998 | -15.348 | -16.696% | -0.444% | N/A |
| 1999 | -9.788 | -36.226% | -0.249% | N/A |
| 2000 | -9.583 | -2.094% | -0.215% | N/A |
| 2001 | -10.555 | 10.143% | -0.211% | N/A |
| 2002 | -11.985 | 13.548% | -0.214% | N/A |
| 2003 | -12.909 | 7.710% | -0.198% | N/A |
| 2004 | -14.296 | 10.744% | -0.196% | N/A |
| 2005 | -14.619 | 2.259% | -0.192% | N/A |
| 2006 | -14.532 | -0.595% | -0.181% | N/A |
| 2007 | -15.560 | 7.074% | -0.181% | N/A |
| 2008 | -16.010 | 2.892% | -0.189% | N/A |
| 2009 | -14.025 | -12.399% | -0.158% | N/A |
| 2010 | -17.017 | 21.333% | -0.188% | N/A |
| 2011 | -17.014 | -0.018% | -0.193% | N/A |
| 2012 | -16.018 | -5.854% | -0.179% | N/A |
| 2013 | -16.018 | 0.000% | -0.176% | N/A |
| 2014 | -17.018 | 6.243% | -0.189% | N/A |
| 2015 | -17.018 | 0.000% | -0.182% | N/A |
Historical Energy Data about Moldova
Total Consumption of Petroleum Products
Oil and Petroleum Products, Net Exports/Imports (-)
Dry Natural Gas Production
Dry Natural Gas Consumption
Dry Natural Gas, Net Exports/Imports (-)
Total Primary Coal Production
Total Coal Consumption
Coal, Net Exports/Imports (-)
Total Electricity Net Generation
Total Electricity Net Consumption
Total Electricity Exports
Total Electricity Imports
Electricity, Net Exports/Imports (-)
Total Conventional Thermal Electricity Net Generation
Hydroelectricity Net Generation
Total Primary Energy Production
Total Primary Energy Consumption
Total Carbon Dioxide Emissions from the Consumption of Energy
Population