| Business / Energy Data |
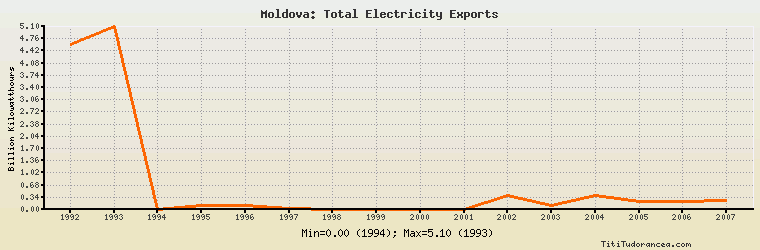
Moldova: Total Electricity Exports
Billion Kilowatthours
| Year | Moldova | Change, percent | Moldova, percent of Eurasia | Moldova, percent of World |
| 1980 | N/A | N/A | N/A | N/A |
| 1981 | N/A | N/A | N/A | N/A |
| 1982 | N/A | N/A | N/A | N/A |
| 1983 | N/A | N/A | N/A | N/A |
| 1984 | N/A | N/A | N/A | N/A |
| 1985 | N/A | N/A | N/A | N/A |
| 1986 | N/A | N/A | N/A | N/A |
| 1987 | N/A | N/A | N/A | N/A |
| 1988 | N/A | N/A | N/A | N/A |
| 1989 | N/A | N/A | N/A | N/A |
| 1990 | N/A | N/A | N/A | N/A |
| 1991 | N/A | N/A | N/A | N/A |
| 1992 | 4.600 | N/A | 3.349% | 1.148% |
| 1993 | 5.100 | 10.870% | 4.066% | 1.273% |
| 1994 | 0.000 | -100.000% | 0.00% | 0.00% |
| 1995 | 0.100 | 0.000% | 0.107% | 0.025% |
| 1996 | 0.100 | 0.000% | 0.112% | 0.023% |
| 1997 | 0.027 | -73.000% | 0.039% | 0.006% |
| 1998 | 0.000 | -100.000% | 0.00% | 0.00% |
| 1999 | 0.000 | 0.000% | 0.00% | 0.00% |
| 2000 | 0.000 | 0.000% | 0.00% | 0.00% |
| 2001 | 0.000 | 0.000% | 0.00% | 0.00% |
| 2002 | 0.400 | 0.000% | 0.621% | 0.077% |
| 2003 | 0.100 | -75.000% | 0.130% | 0.018% |
| 2004 | 0.400 | 300.000% | 0.521% | 0.072% |
| 2005 | 0.220 | -45.000% | 0.295% | 0.036% |
| 2006 | 0.229 | 4.091% | 0.316% | 0.037% |
| 2007 | 0.240 | 4.803% | 0.330% | 0.038% |
| 2008 | N/A | N/A | N/A | N/A |
| 2009 | N/A | N/A | N/A | N/A |
| 2010 | N/A | N/A | N/A | N/A |
Historical Energy Data about Moldova
Total Consumption of Petroleum Products
Oil and Petroleum Products, Net Exports/Imports (-)
Dry Natural Gas Production
Dry Natural Gas Consumption
Dry Natural Gas, Net Exports/Imports (-)
Total Primary Coal Production
Total Coal Consumption
Coal, Net Exports/Imports (-)
Total Electricity Net Generation
Total Electricity Net Consumption
Total Electricity Exports
Total Electricity Imports
Electricity, Net Exports/Imports (-)
Total Conventional Thermal Electricity Net Generation
Hydroelectricity Net Generation
Total Primary Energy Production
Total Primary Energy Consumption
Total Carbon Dioxide Emissions from the Consumption of Energy
Population