| Business / Energy Data |
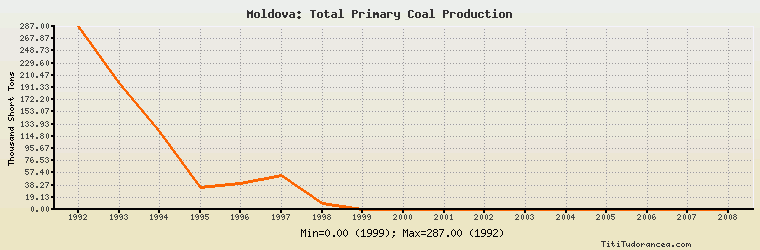
Moldova: Total Primary Coal Production
Thousand Short Tons
| Year | Moldova | Change, percent | Moldova, percent of Eurasia | Moldova, percent of World |
| 1980 | N/A | N/A | N/A | N/A |
| 1981 | N/A | N/A | N/A | N/A |
| 1982 | N/A | N/A | N/A | N/A |
| 1983 | N/A | N/A | N/A | N/A |
| 1984 | N/A | N/A | N/A | N/A |
| 1985 | N/A | N/A | N/A | N/A |
| 1986 | N/A | N/A | N/A | N/A |
| 1987 | N/A | N/A | N/A | N/A |
| 1988 | N/A | N/A | N/A | N/A |
| 1989 | N/A | N/A | N/A | N/A |
| 1990 | N/A | N/A | N/A | N/A |
| 1991 | N/A | N/A | N/A | N/A |
| 1992 | 287.000 | N/A | 0.045% | 0.006% |
| 1993 | 197.000 | -31.359% | 0.035% | 0.004% |
| 1994 | 122.000 | -38.071% | 0.025% | 0.002% |
| 1995 | 35.000 | -71.311% | 0.008% | 0.001% |
| 1996 | 40.000 | 14.286% | 0.010% | 0.001% |
| 1997 | 53.000 | 32.500% | 0.013% | 0.001% |
| 1998 | 8.800 | -83.396% | 0.002% | 0.000% |
| 1999 | 0.000 | -100.000% | 0.00% | 0.00% |
| 2000 | 0.000 | 0.000% | 0.00% | 0.00% |
| 2001 | 0.000 | 0.000% | 0.00% | 0.00% |
| 2002 | 0.000 | 0.000% | 0.00% | 0.00% |
| 2003 | 0.000 | 0.000% | 0.00% | 0.00% |
| 2004 | 0.000 | 0.000% | 0.00% | 0.00% |
| 2005 | 0.000 | 0.000% | 0.00% | 0.00% |
| 2006 | 0.000 | 0.000% | 0.00% | 0.00% |
| 2007 | 0.000 | 0.000% | 0.00% | 0.00% |
| 2008 | 0.000 | 0.000% | 0.00% | 0.00% |
| 2009 | N/A | N/A | N/A | N/A |
| 2010 | N/A | N/A | N/A | N/A |
Historical Energy Data about Moldova
Total Consumption of Petroleum Products
Oil and Petroleum Products, Net Exports/Imports (-)
Dry Natural Gas Production
Dry Natural Gas Consumption
Dry Natural Gas, Net Exports/Imports (-)
Total Primary Coal Production
Total Coal Consumption
Coal, Net Exports/Imports (-)
Total Electricity Net Generation
Total Electricity Net Consumption
Total Electricity Exports
Total Electricity Imports
Electricity, Net Exports/Imports (-)
Total Conventional Thermal Electricity Net Generation
Hydroelectricity Net Generation
Total Primary Energy Production
Total Primary Energy Consumption
Total Carbon Dioxide Emissions from the Consumption of Energy
Population